
First recall the difference between Tracker and Tracking Node from the Glossary. Tracking Nodes are an organizational level in the hierarchy below a branch node. Trackers have activity data and point to one resource. One or more Trackers are attached to a single Tracking Node.
Also recall that, in intensity charts, primary trackers and intensity trackers are rolled up to the chart's Normalizing Grouping to produce normalized results. For more details, refer to the Normalizing by Trackers to Produce Intensity Charts and Reports article.
When Tracker is selected as the Normalizing Grouping, Scope 5 looks for the primary metric and the intensity metric within the same tracker. This means two different metrics from one tracker are compared to produce normalized results.
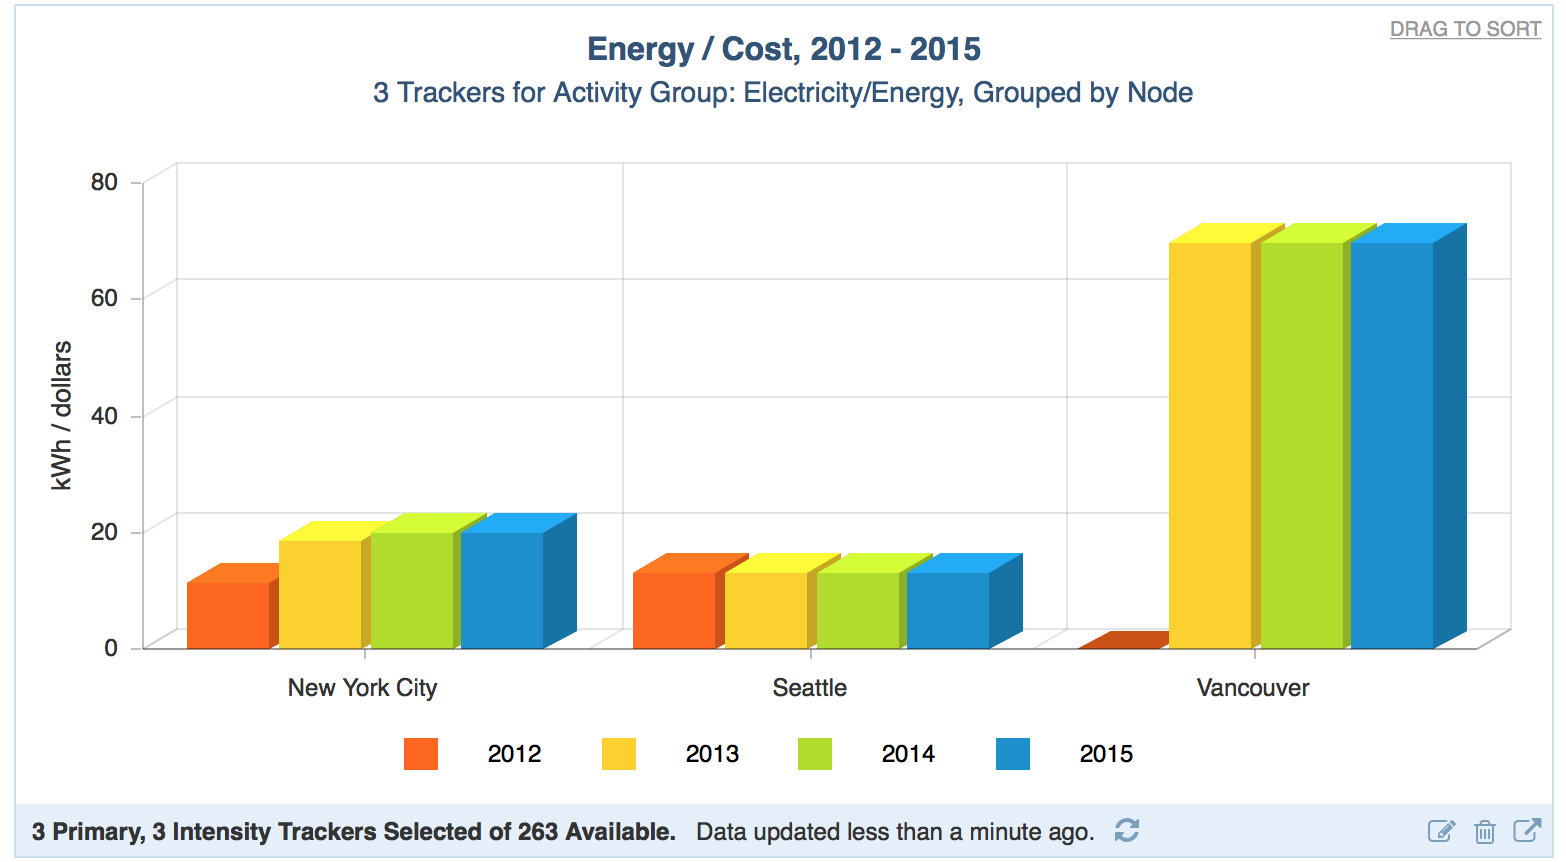
This can be a useful selection when comparing energy/cost, when cost is entered directly with each activity record and its rate changes over time. Both the energy impact and the cost impact come from the same tracker. In this case, Scope 5 plots a series of energy-type trackers, comparing the energy per dollar spent for each individual tracker:
When the Normalizing Grouping is Tracking Node, Scope 5 divides the selected primary trackers by the selected intensity trackers at the level of the Tracking Node that they belong to. This is a useful selection when comparing a tracker (or a group of trackers) to a separate tracker (or group of trackers) that are all under the same tracking node.
Consider this chart of emissions per square foot, compared by scope, as an example:
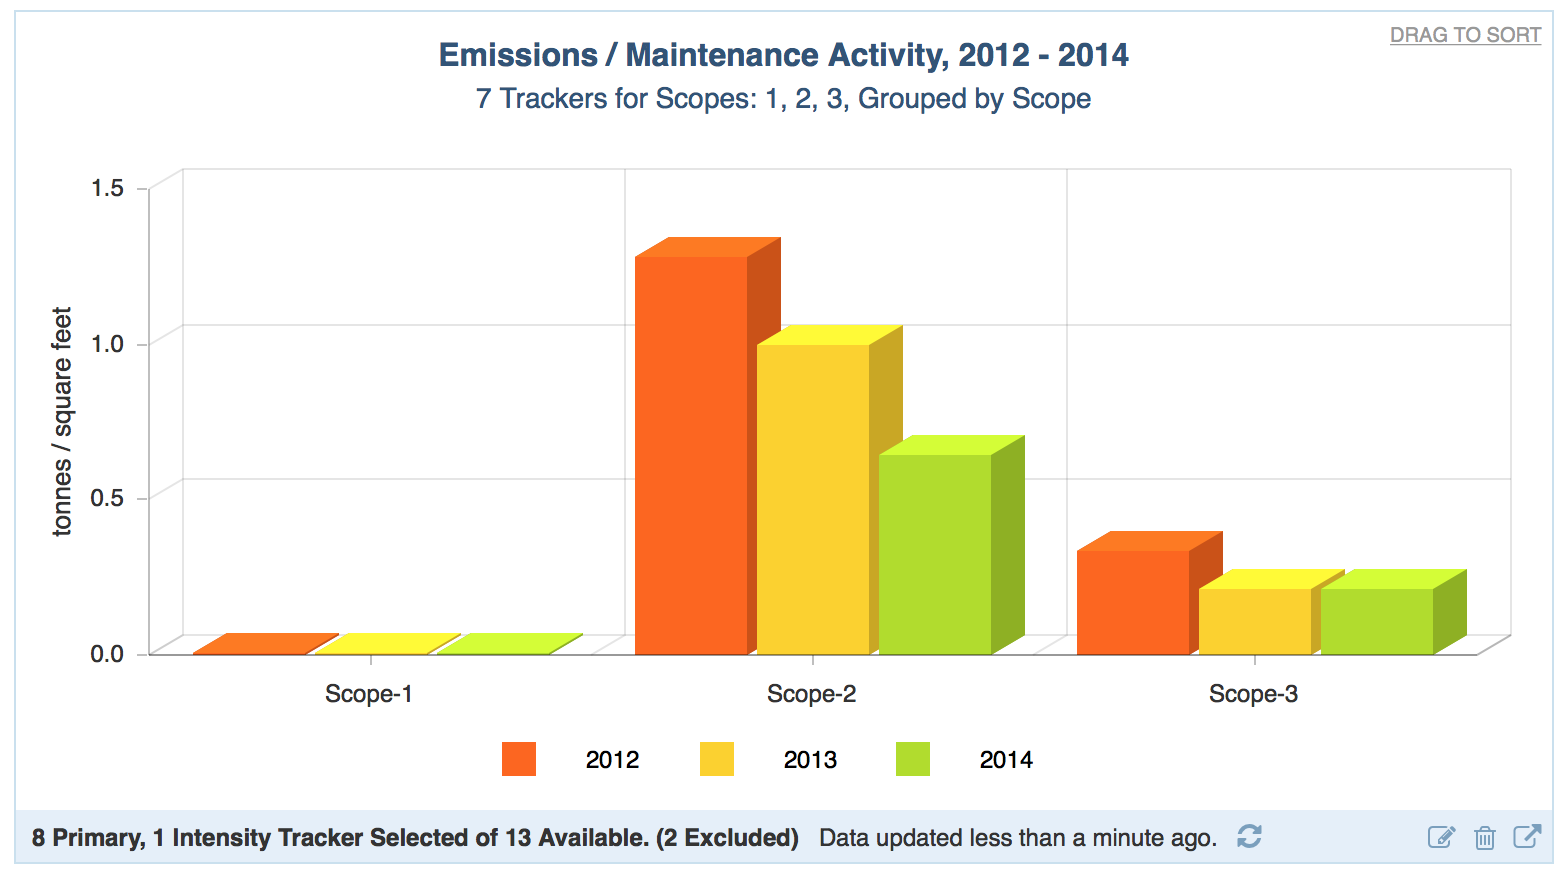
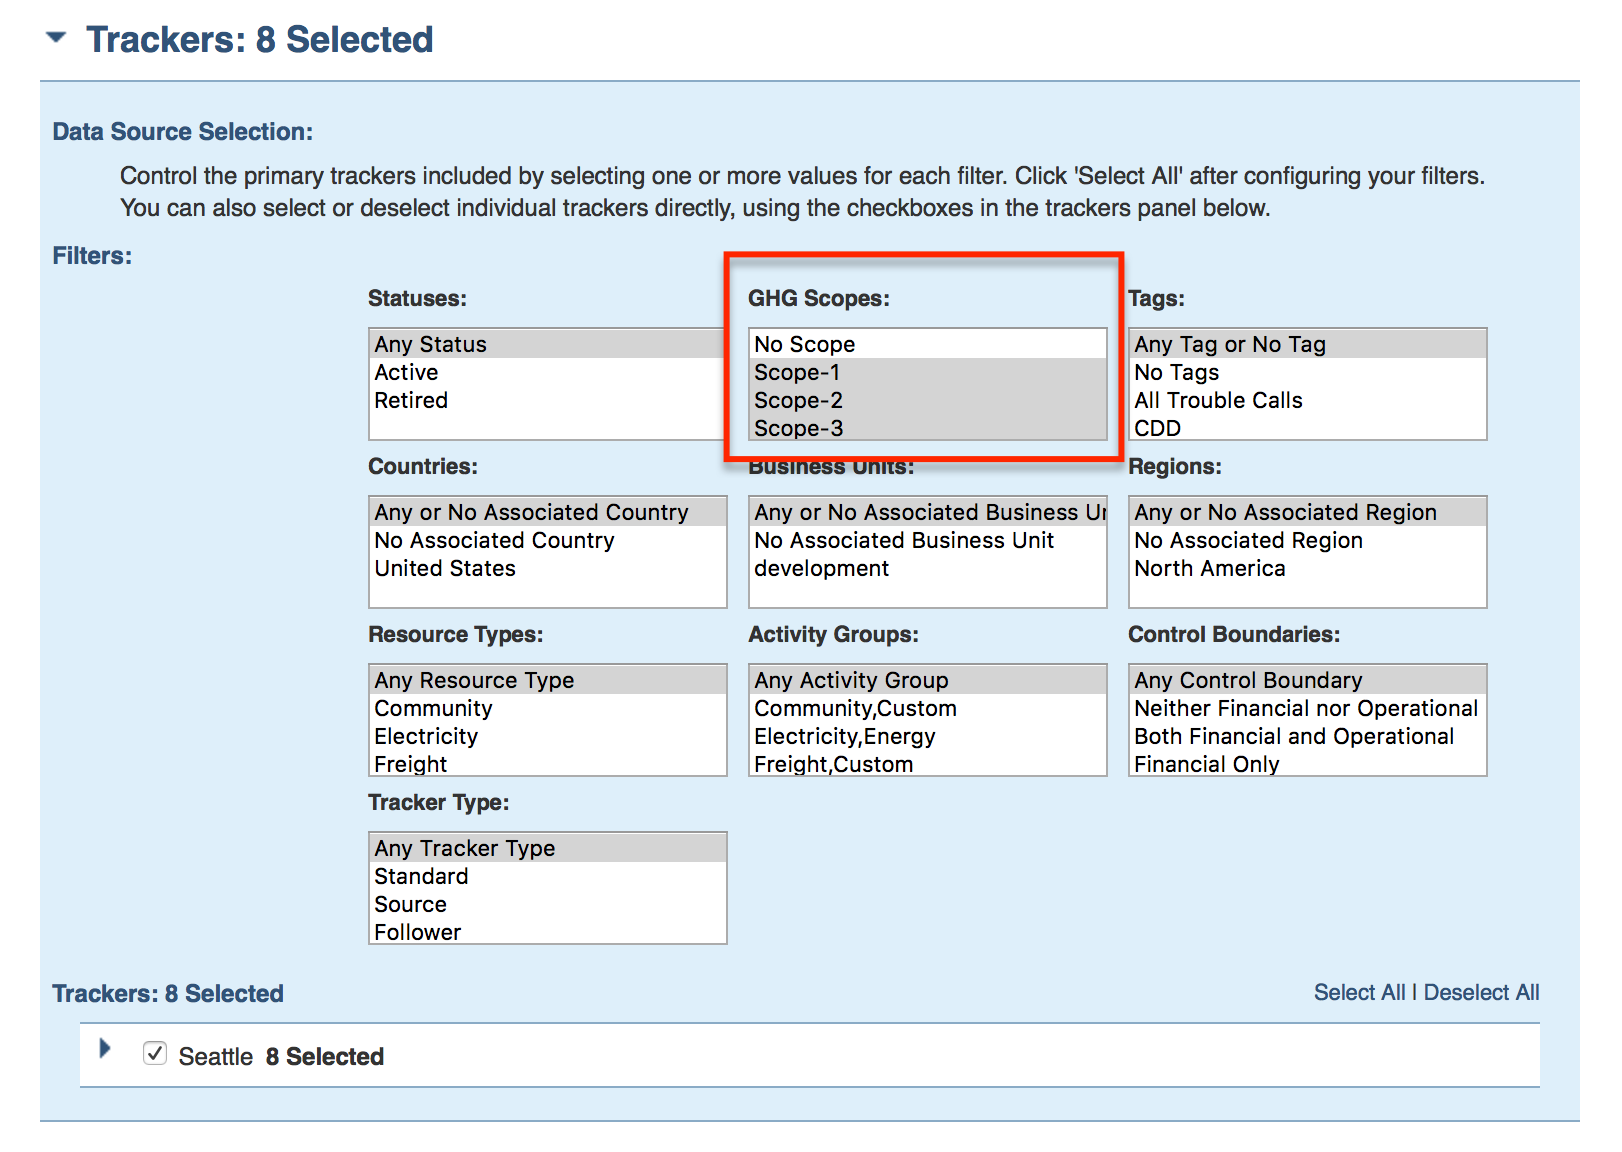
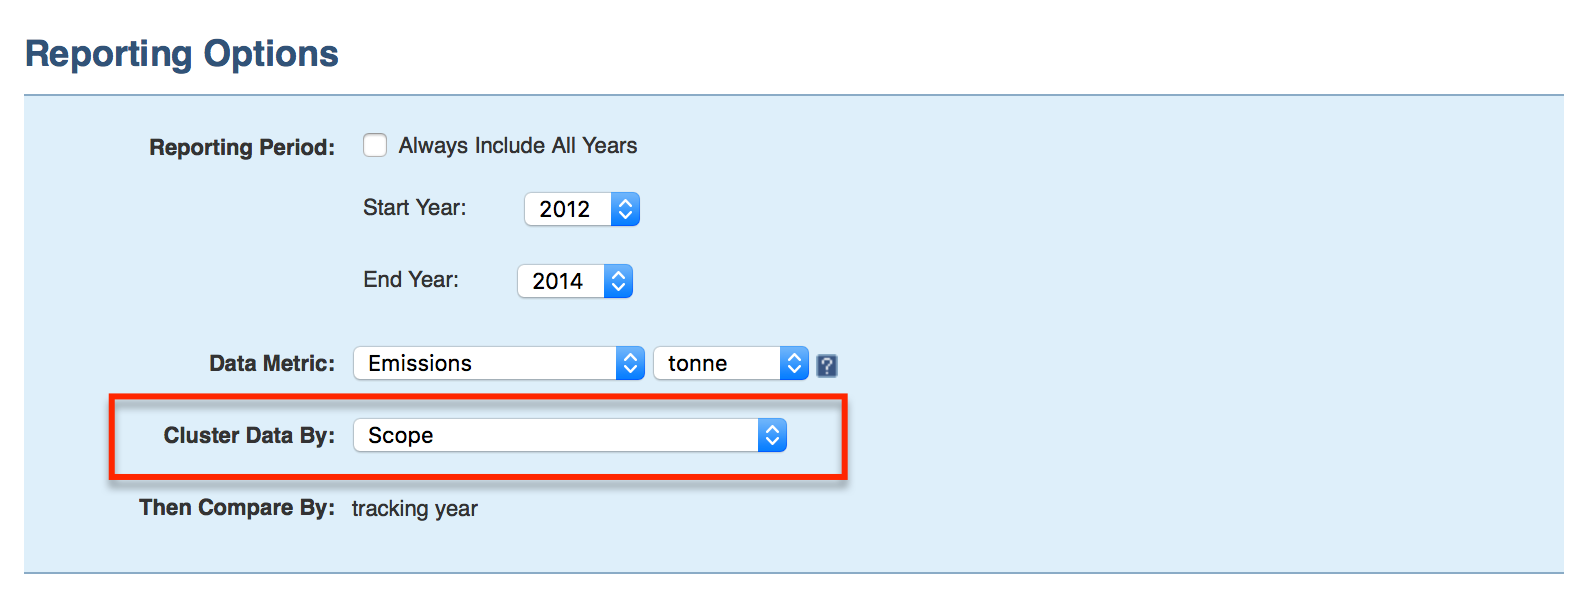
The primary trackers are selected by their GHG Scope and then Clustered By Scope:
Office area, selected using the Activity Groups filter, serves as the intensity tracker. The chart’s Normalizing Grouping, or the level at which the whole chart’s normalized comparison is made, is Tracking Node.
Here, the chart calculates the total emissions from each scope for each year under the Seattle tracking node, and divides each emissions total by the office area total available under the Seattle tracking node.
If Tracker had been identified as the Normalizing Grouping the chart would not have rendered because Scope 5 would have looked for Scope 1 emissions and office area within the same tracker.
Comments