
What are Periodic Reports?
Periodic reports present period-over-period results for a single metric in tabular form. For every grouping, periodic reports present each period's results, and the percent change from the previous period for all periods following the first. Results will be presented for the each tracker, secondary grouping, primary grouping, and the report's total.
For example, a periodic report might compare monthly emissions for the last four months in 2020. Each month except for September (the first month in the report) shows the percent increase or decrease in emissions for that month compared to the previous month, in addition to that month's total emissions.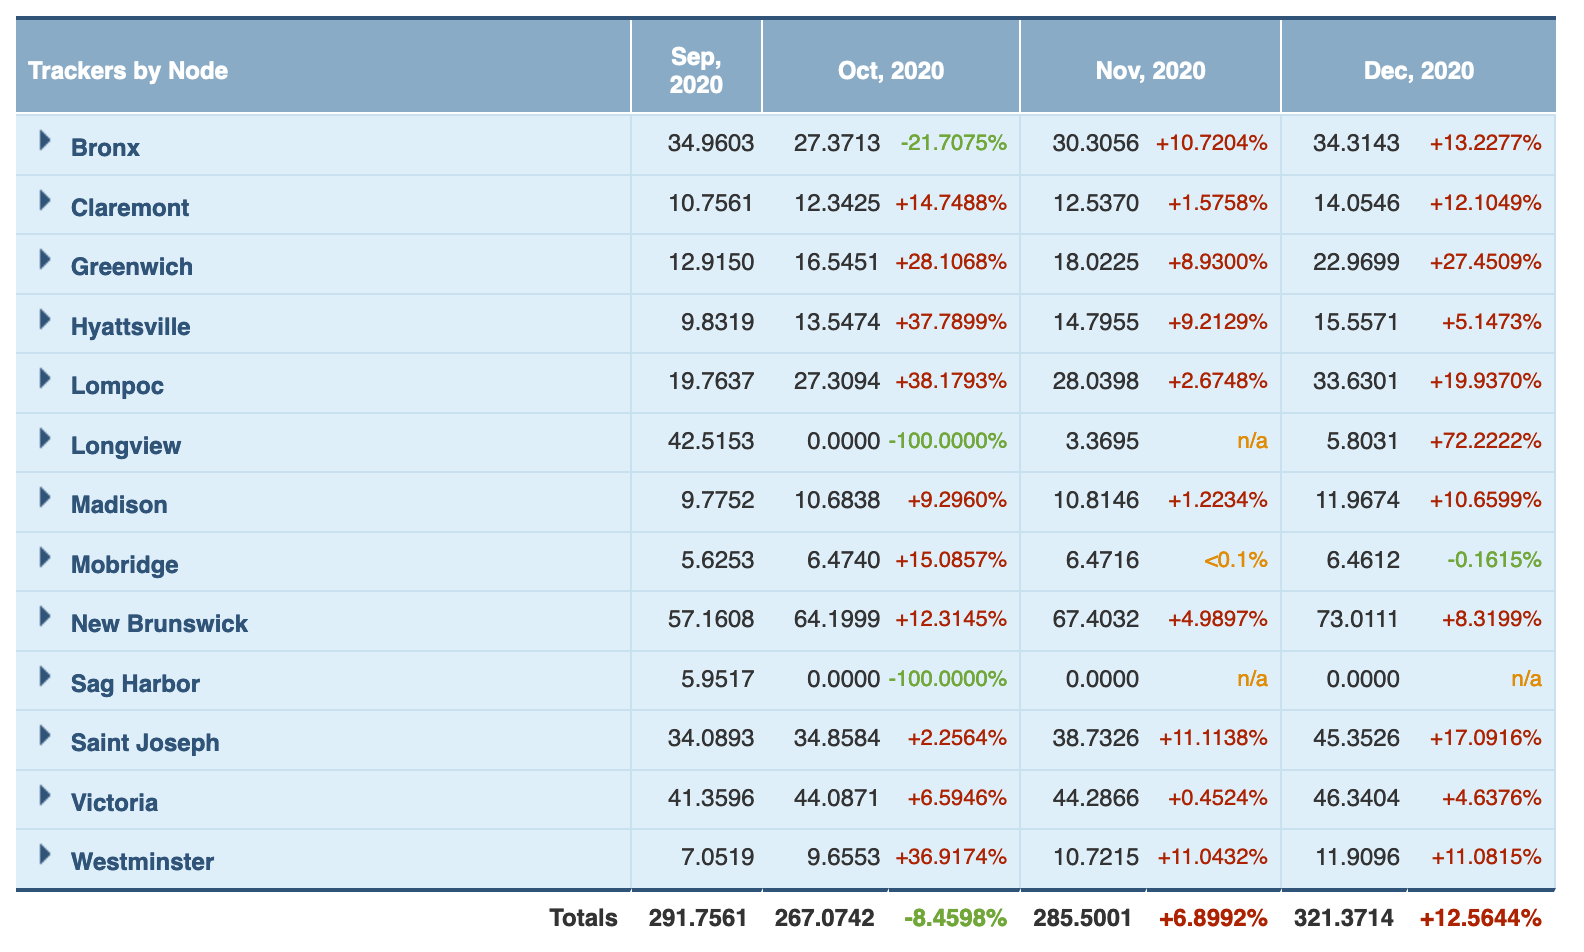
How to Generate Periodic Reports
Navigation
Periodic Reports can be accessed from the left-had side navigation under Reporting. Periodic reports are available at every level of the hierarchy. Reports can include any and all trackers on and below the node where the report is generated.
Trackers
First select which trackers to include in the report. For notes on tracker selection, review this article.
Reporting Periods
Periodic reports can compare results monthly, quarterly, annually, or for an arbitrary period. First, select the radio button for the desired periodicity and then choose which specific periods to include.
Annual periodicity compares results year-over-year. By default, annual periodicity assumes a full calendar year of data. It is also possible to compare an arbitrary period within a year, year-over-year. To do so, enter the desired start date and end date in the boxes below the period selection panel: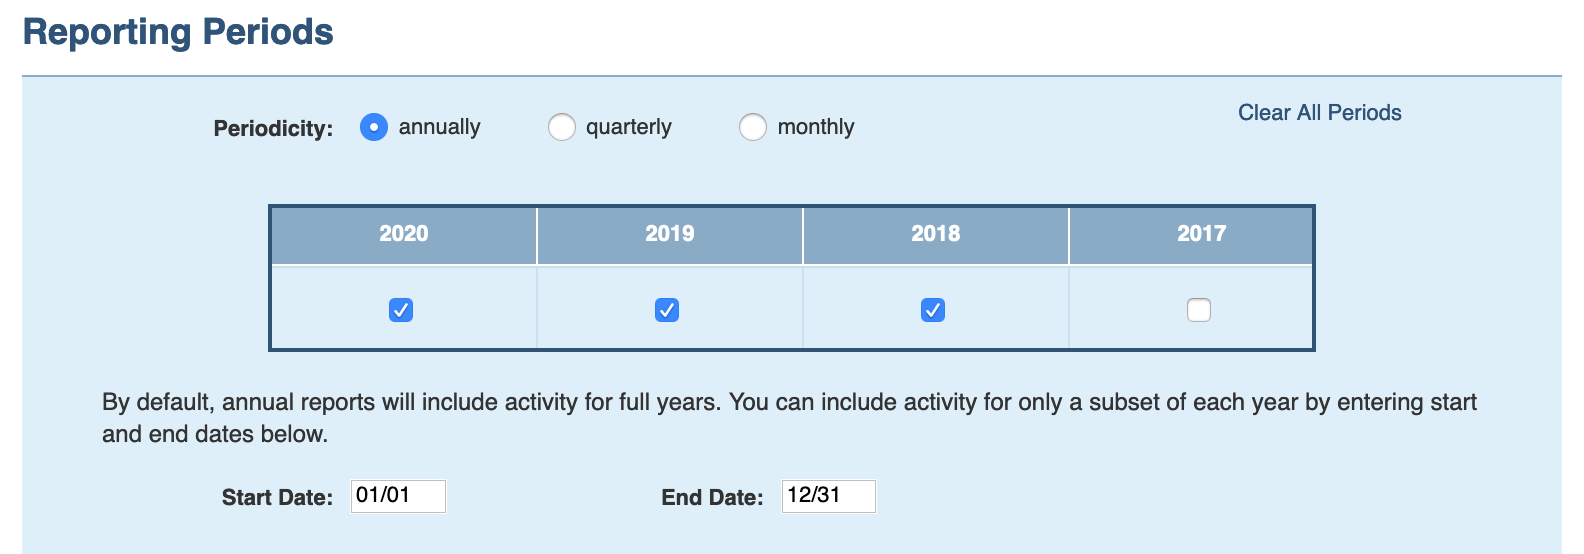
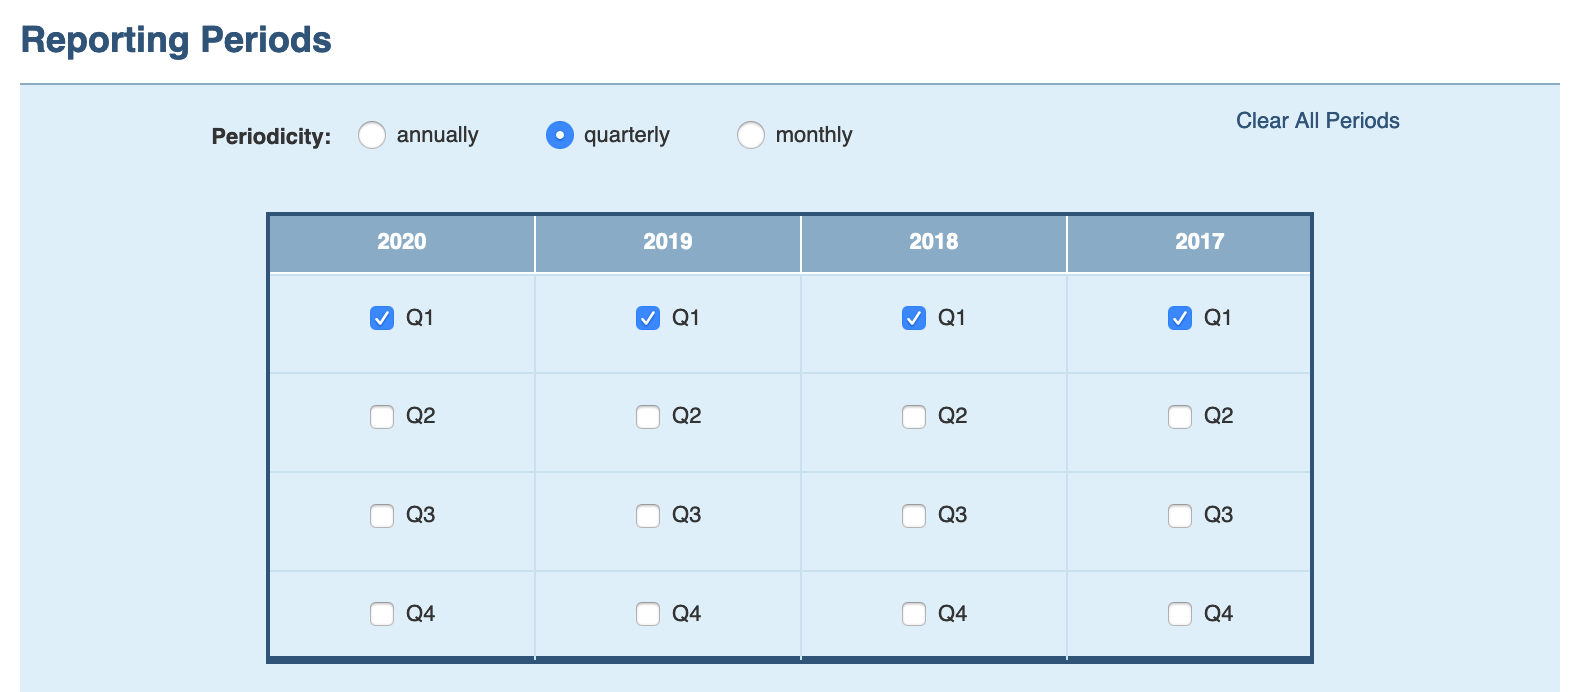
Selecting quarterly or monthly will enable comparison of same month or quarter across different years, or comparison of each month or quarter within the same year:
Data Columns
Periodic reports measure how one metric changes over time. Define the data metric and the units under the data columns pane. If the report displays emissions choose which scope 2 dual reporting method you'd like to use (if applicable).
Normalizing
If you'd like to report on a normalized metric, first select the normalizing trackers from which you'd like to source data under the Normalizing Trackers pane. Then choose whether you'd like to roll results up to the primary grouping or the secondary grouping, and define the normalizing metric and its units under the Data Columns pane. For more details on producing normalized results, view this knowledge base article.
Display Options
Finally choose how you'd like results grouped and presented. The Primary Grouping selection will generate a separate box for each category within the grouping. The Secondary Grouping selection will generate a row within each primary grouping's box. Then, optionally, give your report a title. For an example, scroll below to see Results.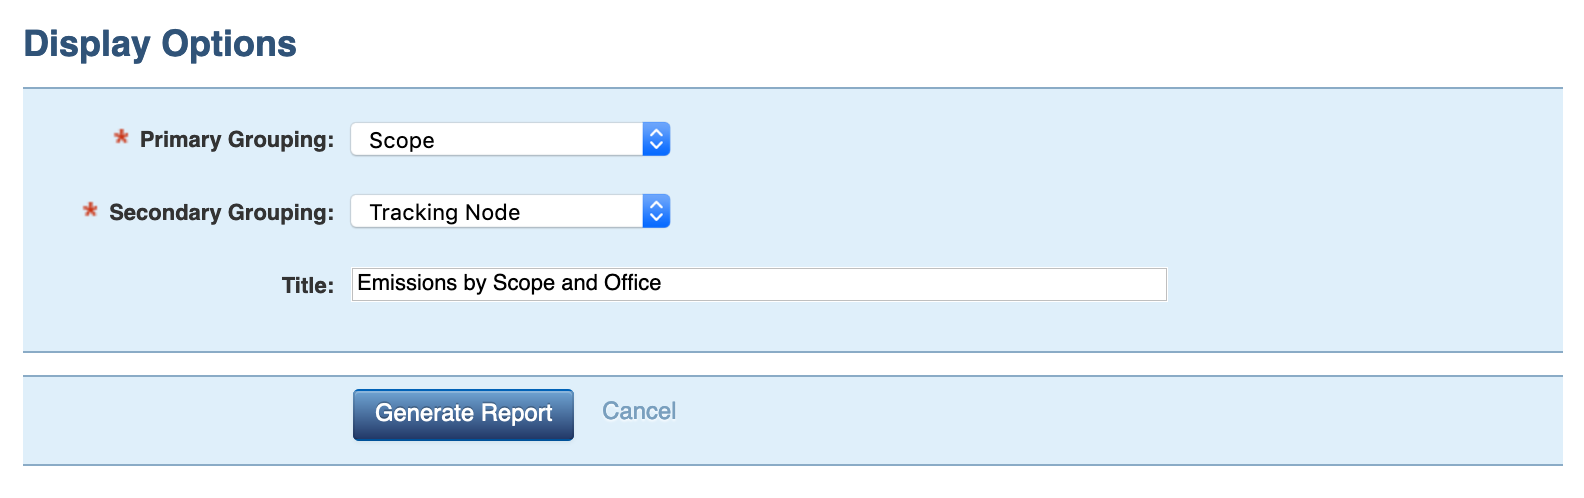
Results
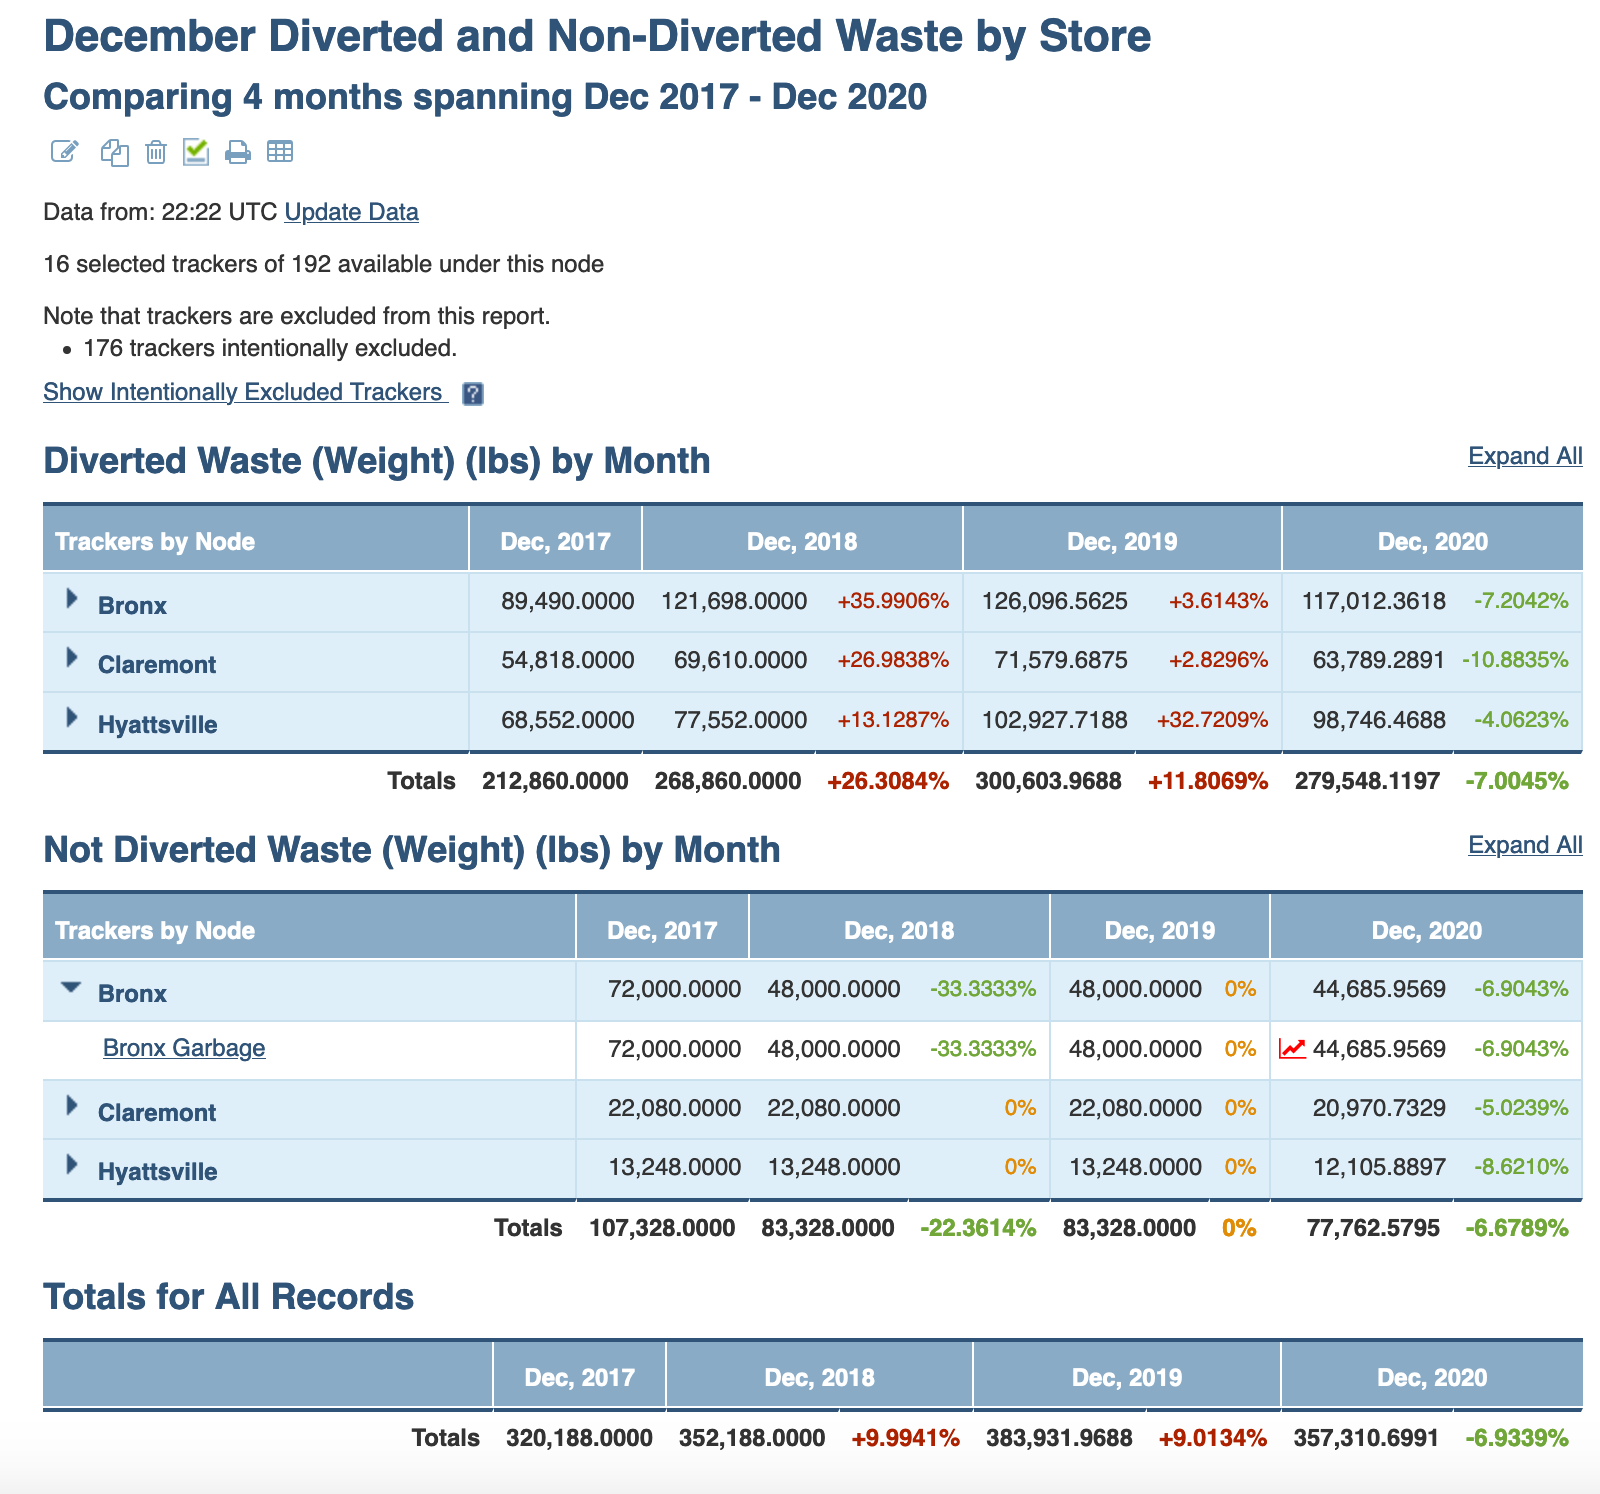
This sample periodic report compares amount diverted waste and non-diverted waste for the month of December across four years: 2017, 2018, 2019 and 2020.
A separate box was generated for each category within the primary grouping: one box for diverted waste, and one box for non-diverted waste. Within each primary grouping, data is compared by the report's secondary grouping of Tracking Node. This enables results to be compared by each tracker, each store, each waste type, as well as the rolled up total at the bottom of the report. For each roll up, we can analyze the amount of waste for that month, as well as the percent change from the previous period, for all periods following the initial one.
Comments