
Introduction - the Purpose of the Audit Trail Functionality
Scope 5 is often used to conduct emissions inventories that are then reported to various authoritative or regulatory bodies. In many cases, reporting organizations contract verifiers to verify that the inventory accurately reflects the organization's activities and resulting emissions. This article is targeted towards both reporters and verifiers. We recommend that reporters seeking verification provide the verifier access to their organization's Scope 5 account. The verifier can then use the audit trail functionality described here to facilitate and expedite the verification process.
Pre-Scope 5 Verification
Often, verifiers are hired to conduct a comprehensive review of an inventory. In this case, verifiers may start by touring or examining an organization's facilities and activities to be sure that all relevant emissions generating activity has been considered. They may ask to see utility bills or accounting records to be sure that all activity has been correctly accounted for. These type of verification tasks rely on investigation that is beyond the scope of Scope 5.
Verification Using Scope 5
Once the verifier has confirmed to their satisfaction that all relevant activity data has been accurately captured, remaining verification amounts to confirming that the all relevant activity data is accurately converted to reported results. (The most common reported impact metrics are emissions and energy but in certain cases there may be other important metrics reported). This is where Scope 5 comes in.
Reporters enter raw activity data into Scope 5. In turn, Scope 5 converts this activity data to reported impact metrics. The verifier must correlate the impact data calculated by Scope 5 to the raw activity data from which it was calculated. This process is somewhat bi-directional, as illustrated below.
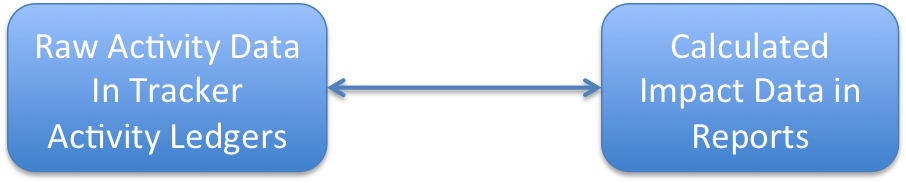
Figure 1 - the Relationship Between Raw Activity Data and Reported Impact Data
In the remainder of this article, we'll delve into this process, with a particular focus on Scope 5 processing and audit trail functionality.
Trackers and Activity Ledgers
Having confirmed previously that all relevant activity data has been captured, the verifier must also confirm that the captured data has been completely and correctly entered into Scope 5. To do so, the verifier might examine listings of all the trackers in an organization's Scope 5 account. Scope 5 trackers are used to tally activity for each of the organization's emissions sources.
Trackers represent the finest level of granularity at which an organization's activity data can be categorized in Scope 5. Each tracker has an activity ledger that is used to tally the corresponding activity data. A sample tracker listing and one of the trackers' activity ledgers are illustrated below. These are common facets of the Scope 5 user interface.
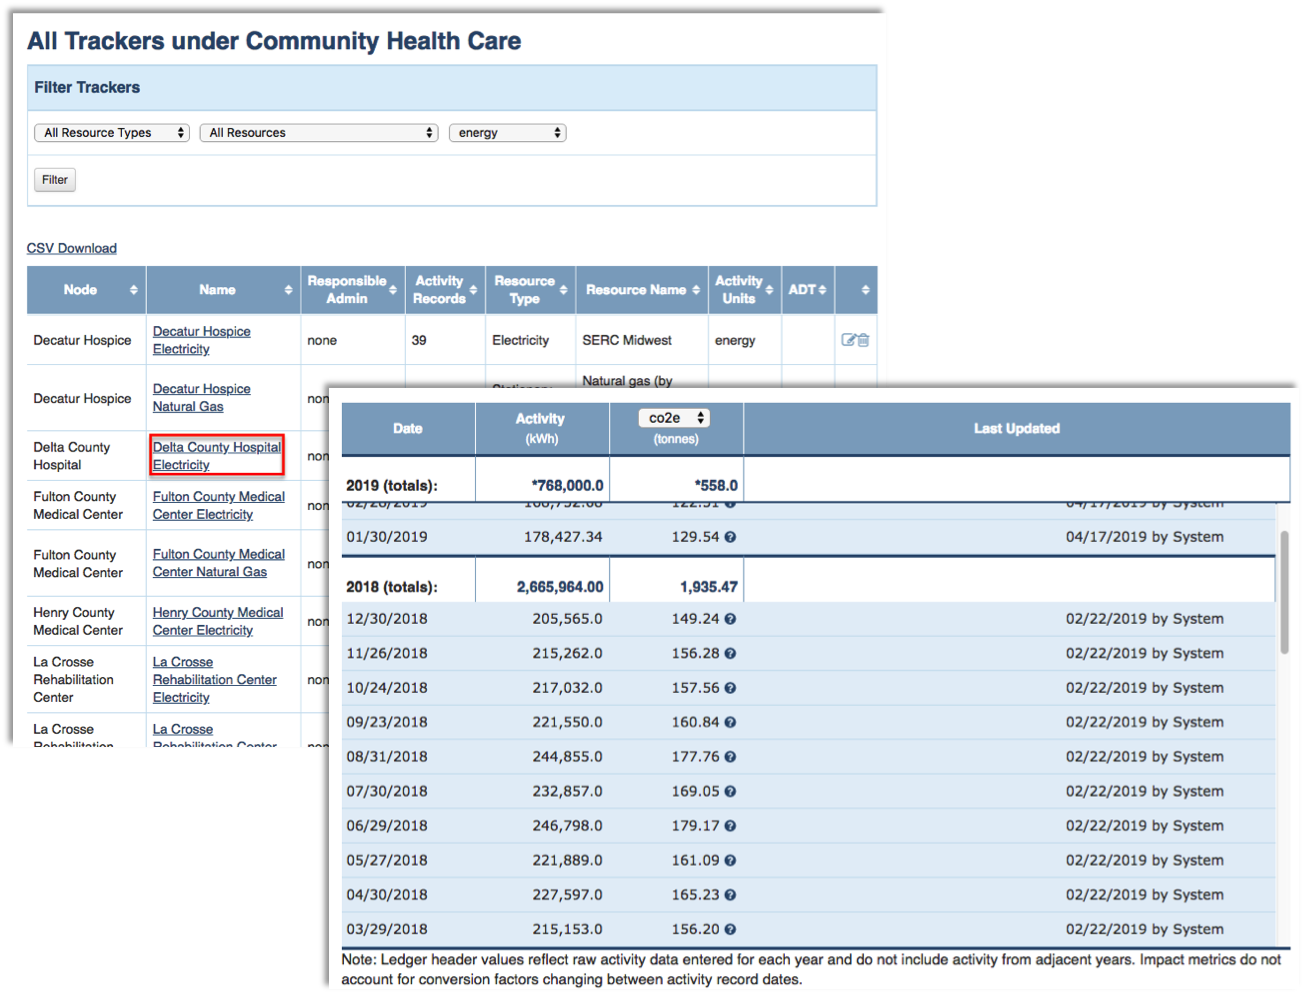
Figure 2 - the Tracker Listing and an Activity Ledger
To help confirm raw activity data, reporters may include notes and may upload files to support any activity record entered into an activity ledger. The presence of such supporting information is indicated by a question mark icon to the right of the user that provided the information. In the illustration below, we see that Riley Cunningham has provided supporting information for the activity record dated February 28th, 2019. To access it, a verifier would simply click on the activity record in the activity ledger.
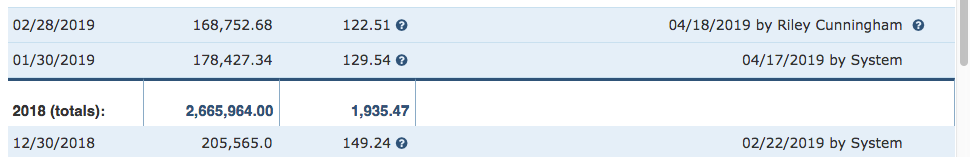
Figure 3 - Activity Records Can Carry Supporting Information
Once the verifier is confident that all the raw activity data is accounted for and has been completely and correctly entered into Scope 5, the next task is to confirm the correctness of the processing steps that Scope 5 applies to convert the activity data to impact data. Scope 5's audit trail functionality is designed to do just this.
Following the Audit Trail - A Typical Verification Scenario
To see how Scope 5's audit trail works, let's assume a typical verification scenario; the reporter is reporting an organization's emissions to the Carbon Disclosure Project (CDP). One of the CDP questions asks for the organization's total Scope-2 emissions for calendar year 2018 (for simplicity's sake, we'll ignore for now the complexities of dual-reporting). The reporter has used Scope 5 to quantify these emissions and is asking the verifier to verify the resulting number. To do so, the reporter gives the verifier access to the Scope 5 online Distribution Report generated to quantify emissions for calendar year 2018. (So far we've been discussing the verification process from the perspective of the activity data, forward. At this point, we're going to look from the perspective of the reported results, backward). The reporter must also be sure to turn on auditing for the report. To do so, the reporter must check the Include Audit Trail checkbox under Display Options in the report's create or edit form.
Note that in order to access audit trail functionality, the reporter's Scope 5 account must be enabled for audit trail. If your account is not enabled for audit trail, please contact your Scope 5 account representative.
An excerpt from a Scope 5 distribution report is illustrated below.
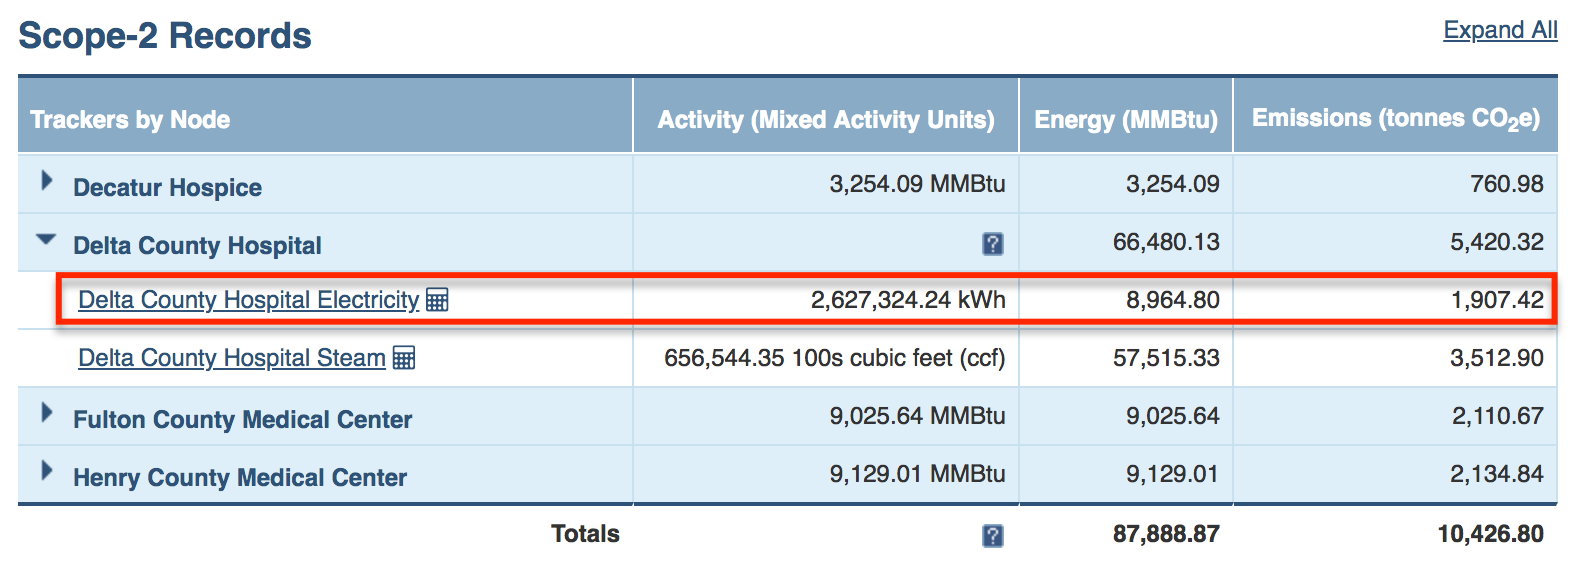
Figure 4 - Excerpt from Sample Scope 5 Distribution Report
The report rolls up processed results originating from multiple emissions sources (and their corresponding activity ledgers). Reports present a separate table for different categories of emissions. The report illustrated in Figure 4 categorizes results by emissions scope. The specific excerpt illustrates the table quantifying Scope-2 emissions.
Working from the report backwards:
- The verifier first compares the rolled up Scope-2 emissions (from the Totals row at the bottom of the table), with the total Scope-2 emissions reported to the CDP by the reporter (in this case, 10,426.8 tonnes CO2e). Now the verifier must confirm that the rolled up number in the report accurately reflects the emissions generated by the relevant emissions sources.
- Within the table, results are organized by facility. Each of the four blue rows in the table quantifies the corresponding facility's contribution to the total Scope-2 emissions. The verifier can use simple addition to confirm that the total number at the bottom of each column of the table is indeed the sum of the entries in the corresponding column across each of the facilities tabulated.
- Each facility row can be expanded to reveal results from all contributing emissions sources (trackers) at that facility.
- The Delta County Hospital Electricity tracker is highlighted in Figure 4. From the report, we see that this tracker tallied a total of 2,627,324.24 kWhs over the reporting period. We also see that Scope 5 has converted this activity to 8,694.8 MMBtu of energy and 1,907.42 tonnes of CO2e.
- This is where the audit trail becomes important. We're asking the verifier to make several leaps here - first, to confirm that indeed the total activity for this tracker over the reporting period corresponds to the number in the Activity column and second, that that quantity of electricity consumed would indeed generate the emissions quantified in the last column.
The verifier might also seek to confirm the number in the Energy column. In this example, the conversion from activity to energy amounts to simple unit conversion from kWh to MMBtu and does not require the audit trail functionality. However, in general, activity units may not be expressed in energy (think gallons of diesel fuel) and the same audit trail functionality that illustrates conversion of activity to emissions will be used to illustrate conversion of activity to energy.
Verifying Results on a Tracker by Tracker Basis
After the verifier has verified that the relevant Scope 5 reports are internally consistent as explained in steps #1 and #2 above, further verification amounts to the work described in steps #3, #4 and #5 - verifying that the results tabulated in each row of the reports reflect correct processing of the raw activity data entered into Scope 5 for the corresponding emissions source or tracker. Verifiers may choose to verify the processing for each and every tracker or may sample a representative subset of the trackers.
The General Case and the Trivial Case
Generally, the processing of raw activity data is complicated by the fact that most activity data does not conveniently temporally align with reporting periods. For example, raw activity may be quantified using monthly utility bills that specify usage for service periods that start and end on approximately (but not exactly) the same day each month while reporting periods typically span one exact fiscal or calendar quarter or year. Even if activity data does align perfectly with reporting periods, conversion factors (used to convert activity to impacts) may not.
As such, much of Scope 5's processing involves prorating activity data to specific date boundaries. In certain cases, all of the raw activity data aligns perfectly with the reporting period and conversion factors are consistent throughout the reporting period. In these cases, Scope 5's processing and the corresponding audit trail functionality is quite streamlined. Most of the remainder of this article explains the processing and audit trail for the general case. Readers concerned only with the streamlined case described above (in which all dates are aligned) may skip directly to the section near the end of this article where this special case is explained concisely.
Back to the Activity Ledger
If you've reached this point, you're probably interested in the general case and your Scope 5 account's typical activity ledger probably looks something like the sample ledger illustrated below for the Delta County Hospital Electricity tracker.
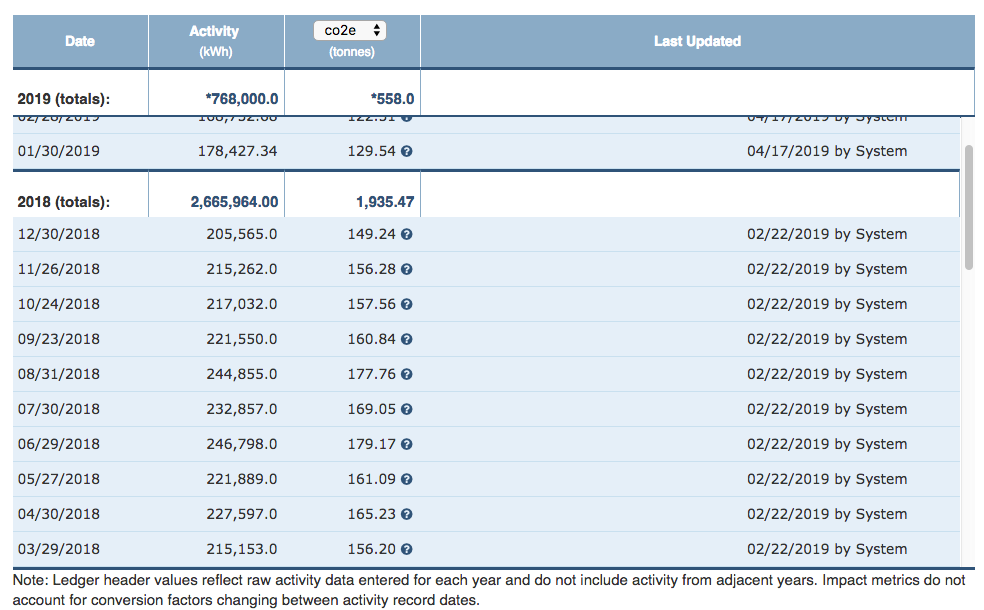
Figure 5 - The Delta County Hospital Electricity Activity Ledger
One of the first processing steps that Scope 5 applies in going from raw activity data to reported impact data is prorating each relevant tracker's activity data to the appropriate reporting period, in this case, calendar year 2018.
In step #4 above, we saw that the prorated activity presented in the report is 2,627,324.24 kWhs. How did Scope 5 calculate this number? If we look at the 2018 (totals) header in the activity ledger, we see a different number! The explanation for this discrepancy is that the number in the header of the activity ledger simply totals all activity records dated with a date in calendar year 2018, while the activity number presented in the report quantifies the electricity actually consumed during calendar year 2018.
To see how these might be different, consider that the last activity record with a date in 2018 is dated December 30th. This tracker, like most utility trackers, is accruing, meaning that the date of each activity record represents the end of a service period during which the activity quantified by the activity record was incurred. The 205,565 kWh represented by the activity record was incurred over a period starting the day after the previous record (November 27th) and ending on the date of the activity record (December 30th). Some of the activity incurred in 2018 is included in the first record recorded in the 2019 block of the activity ledger. Specifically (assuming that electricity is consumed uniformly across the period of each activity record), 1/31st of this 2019 activity record's activity was incurred during the last day of 2018.
Although the first activity record of 2018 is not visible in Figure 5, we can assume that some part of it's activity was actually incurred in 2017 and so, it too has to be prorated. At this point, we refer to the audit trail for the tracker.
Launching the Audit Trail Window
The first use for the audit trail is to confirm that Scope 5 is prorating activity correctly from the tracker's activity records to the total activity reported in the report for calendar year 2018. We launch the audit trail for the tracker by clicking on the calculator icon immediately following the tracker name in the report (see Figure 4). Doing so brings up the popup window illustrated in Figure 6.
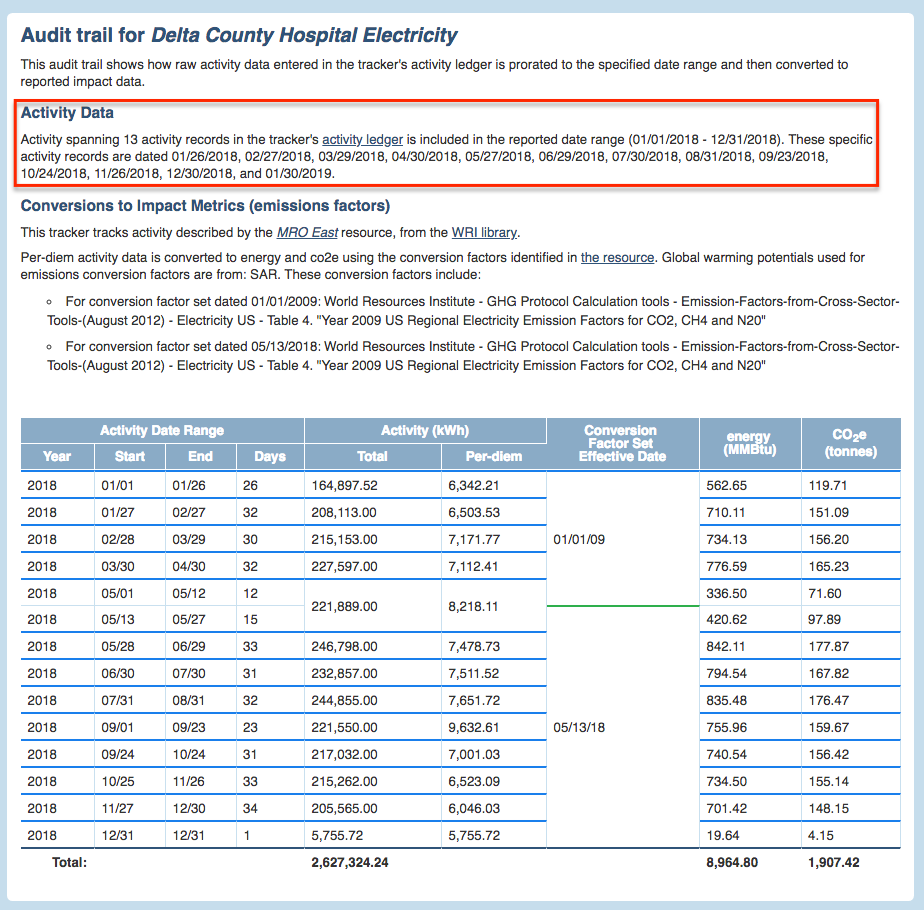
Figure 6 -Audit Trail Window for Delta County Hospital Electricity
The highlighted text in the audit trail, under the heading Activity Data identifies the activity records in the ledger that contribute to the total activity for calendar year 2018 (by the record dates). We see immediately, that there are actually 13 activity records contributing to 2018 activity - 12 that are dated in 2018 plus the first activity record dated in 2019 that we previously identified. We can easily go directly to the tracker's activity ledger to inspect these activity records, by clicking on the activity ledger link in the highlighted frame in the audit trail window.
Scanning down to the table at the bottom of the audit trail window, we see that the audit trail identifies 13 sub-periods (delineated by horizontal bold lines) that correspond to the 13 activity records in the activity ledger. Together, these sub-periods exactly quantify all activity incurred in 2018. (Although there are 13 sub-periods, there are 14 rows because the period spanning May 1st to May 27th is split into two sub-rows - more on this later).
The numbers in the 2nd and 3rd columns of the table specify the start and end dates (inclusive) of the period spanned by each row. (The 4th column specifies the number of days in each period). Looking at the last row in the table, we see that it corresponds to a single day - that last day in 2018 that was accounted for in the first record of 2019.
Note that the sample tracker discussed here is accruing. The same discussion applies to ongoing trackers with a couple of differences; for accruing trackers, the date of each activity record indicates the end of the activity period whereas for ongoing trackers, the date of each activity record indicates the start of the activity period. It follows that, to correlate sub-periods identified in the table in the audit trail window with the corresponding activity records in the activity ledger, we use the dates from the 3rd column of the table (End) for accruing trackers but we use the dates from the 2nd column (Start) for ongoing trackers. See this article for a discussion of ongoing vs. accruing trackers.
Per-Diem Activity Numbers
Refer to the 6th column in the table at the bottom of the audit trail window (in Figure 6). It quantifies a per-diem activity. Scope 5 calculates this number by dividing the activity in each activity record by the number of days spanned by the activity record. This number corresponds to the activity incurred each day during the period spanned by the activity record. Refer back to that activity record dated January 30th, 2019 that we saw in the activity ledger in Figure 5. The record quantifies 178,427.34 kWhs consumed over the 31 day period ending with the record date of January 30th, 2019 and starting one day after the previous record date of December 30th, 2018. Dividing that number by the 31 days in the period produces the per-diem consumption of 5,755.72 kWhs that is tabulated in the corresponding position in the audit trail table at the bottom of Figure 6.
One of the first steps that Scope 5 performs in processing activity data is the calculation of per-diem activity numbers. These numbers drive all of the subsequent processing steps, ultimately leading to the results quantified in the report.
The 5th column in the audit trail table quantifies exactly, the total contribution of each of the sub-periods in the table to the total activity incurred during the reporting period. Since the sub-period corresponding to the bottom row in the table spans only a single day, the per-diem amount contributed by the sub-period is equal to the total amount contributed. For all sub-periods delineated by the bold lines in the audit trail table, it is true that the total activity for the sub-period (in column 5) is equal to the number of days in the sub-period (in column 4), multiplied by the per-diem activity (in column 6).
In this example, for all but the top and bottom rows in the table, the total activity is exactly the same as the activity in the corresponding raw activity record from the tracker's activity ledger. This is illustrated below, in Figure 7, which shows the table from the audit trail window (on the right), superimposed over the raw activity records in the activity ledger (on the left).
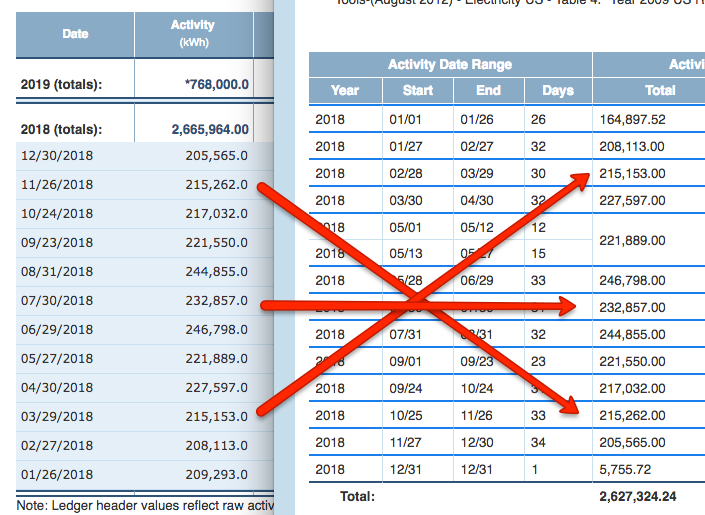
Figure 7 - Comparison of the Audit Trail Window and the Activity Ledger
The bottom-most record in the activity ledger and the bottom-most sub-period in the audit trail table have no apparent match because these correspond to the two activity records for which proration is applied. These activity records span but do not align with, the start and end of the reporting period (calendar year 2018). It is these two mismatches that account for the difference between the 2,665,964 number in the header of the activity ledger (which quantifies the sum of all activity records dated in 2018) and the 2,627,324 number at the bottom of the audit trail table (which quantifies the sum of all activity actually incurred during the reporting period - calendar year 2018).
Confirming Incurred Activity
Below, in Figure 8, we show again the excerpt from the report that the verifier is verifying. The verifier will no doubt be pleased to see that the total activity for the tracker of interest incurred during the reporting period and quantified at the bottom of the table in the audit trail window matches the number in the second column of the highlighted row in the report output. The table in the audit trail window shows how Scope 5 prorated the numbers from a set of raw activity records to calculate this result. (Note that while it's good practice for the reporter to include the activity column in the generated report, it is not necessarily a required column and certain reports may not include it).
Figure 8 - the Report Output
Using Per-Diem Activity to Calculate Impacts
Once Scope 5 has calculated the per-diem activity for each of the sub-periods tabulated in the audit trail table it has all the information necessary to move on to the next processing step - the calculation of each of the impact metrics for the reporting period (in this example the impacts include energy and emissions, quantified in the 3rd and 4th columns of the report output in Figure 8). We'll examine this step in the next section.
Conversions
In order to quantify impacts, Scope 5 multiplies activity for each sub-period by the appropriate conversion factors. Let's take another look at the narrative above the table in the audit trail window (that we first saw in Figure 6). This time we'll focus on the conversions rather than the activity. See Figure 9:
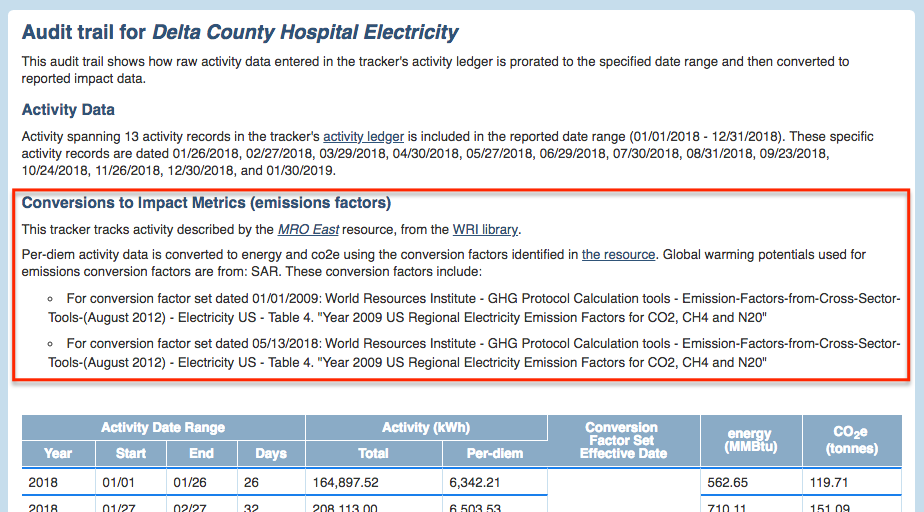
Figure 9 - The Audit Trail Explanation of Conversions Applied
Resources, Libraries, Conversion Factor Sets and Global Warming Potentials
The first sentence regarding conversions in the audit trail window identifies the resource used to convert activity and the library to which it belongs. In Scope 5, each type of activity is described by a corresponding resource from one of the resource libraries. The resource identifies the type of units in which activity is expected to be quantified (energy in our example) and it includes the conversion factors that should be used to convert activity to each of the impact metrics. The resource (in this case, MRO East) and the library (in this case, the GHG Protocol library) references are both hyperlinked so that the verifier can easily inspect both.
The second sentence in this section of the audit trail window identifies two important additional pieces of information. The first is the impact metrics that are being reported (in this case energy and co2e, a.k.a. emissions). The second piece of information is the source of the global warming potentials (GWPs) being used to calculate the co2e emissions. (Note that in certain cases no GWPs are included in the audit trail explanation. This will be the case when either no emissions are reported or emissions are reported but only CO2 emissions are quantified by the conversion factors in the resource used - the GWP for CO2 is, by definition '1'). In the example above emissions are calculated using conversion factors in the MRO East resource and these factors use global warming potentials from SAR.
The final narrative before the audit trail table lists the resource's conversion factor sets that are used in the conversions. These can be examined directly, using the resource's hyperlink, MRO East which would take the verifier to the screen illustrated below, in Figure 10:
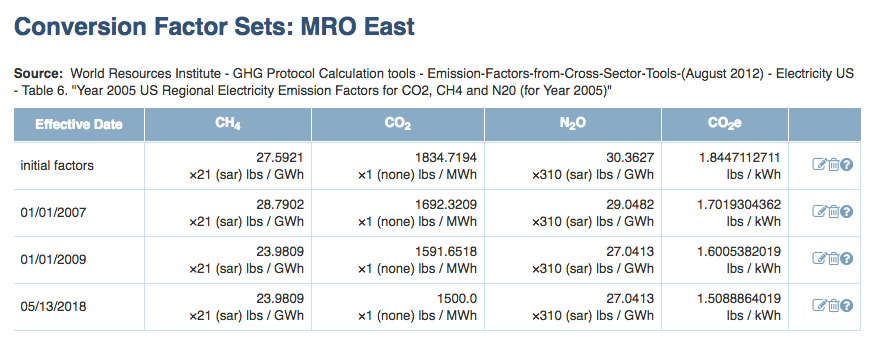 Figure 10 - The MRO East Resource and its Conversion Factor Sets
There are several things to note about resources and conversion factor sets. The first, is that a resource can have zero, one or more conversion factor sets. The second is that each set has an effective date which indicates the first date on which that conversion factor set applies.
Not all reports will use all of a resource's conversion factor sets. In this example, the reporting period is calendar year 2018. The last conversion factor set in Figure 10 has an effective date in the middle of 2018. So - this set applies to all activity that occurs on or after May 13th in this report. The previous conversion factor set (dated January 1st, 2009) applies to activity occurring earlier in the reporting period (January 1st, 2018 through May 12th, 2018).
(Note that the MRO East example corresponds to an actual set of emissions factors provided by the EPA. However, the specific conversion factor sets illustrated here are fictional, contrived for the purpose of illustrating the example).
The two conversion factor sets that are actually used by Scope 5 in generating the report are identified by their effective dates in the two bullets at the bottom of the highlighted section of the audit trail window illustrated in Figure 9. (The audit trail window includes any source and description narrative that is attached to the conversion factor sets in the resource library).
Applying Conversion Factor Sets
Scope 5 applies the conversion factors in each of the conversion factor sets based on activity dates and the specific impact metrics selected for reporting, as appropriate. In this example, the report that is being verified quantifies total CO2e emissions. So - the conversion factors for CH4, CO2, and N2O are ignored. Since the report spans activity for all of calendar year 2018, it uses the conversion factors for CO2e from the two conversion factor sets discussed above.
To apply these conversion factors, Scope 5 first multiplies the per-diem activity during each sub-period by the number of days in the sub-period to arrive at the total activity in the sub-period. Next, it multiplies that activity by the appropriate conversion factor for the sub-period.
This is where the importance of per-diem activity becomes apparent. If applicable conversion factors remained constant throughout each period spanned by an activity record, it would not be necessary to calculate per-diem activity for the sake of calculating impact metrics - we'd simply multiply the total activity incurred in each activity period by the conversion factors for the activity period. However, in the example illustrated, the conversion factors change on May 13th, 2018. This is smack in the middle of the activity period spanned by the activity record dated May 27th (which spans the period starting the day after the previous activity period, May 1st, and ending on May 27th). This activity record is illustrated below in an excerpt from the tracker's activity ledger:
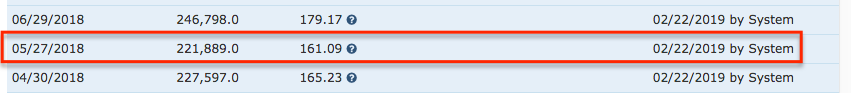
Figure 11 - Activity Period Spanning Two Conversion Factor Sets
Because the activity period of interest spans two different conversion factor sets, it must be converted to CO2e on a prorated basis - with the first part of the activity converted using the conversion factor from the first set and the second part of the activity using the conversion factor from the second set. This is where the per-diem activity numbers are so useful and this is why the fifth activity period identified in the table in the audit trail table is split into two sub-rows. Refer to the excerpt from the audit trail window illustrated in Figure 12:
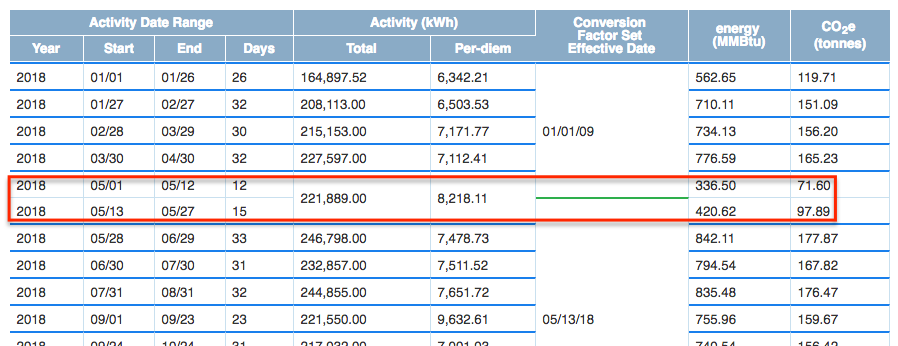
Figure 12 - Sub-Rows in the Audit Trail Table for Conversion Factor Set Changes
The first sub-row corresponds to the 12 days of activity that should be converted using the conversion factor from the first set. The second sub-row corresponds to the remaining 15 days in the activity period that should be converted using the conversion factor from the second set. To get the first CO2e number of 71.6, Scope 5 first multiplies the per-diem activity for the period by the 12 days that make up the first sub-period and then multiplies that activity total by the conversion factor from the set dated January 1st, 2009. To get the second CO2e number of 97.89, it first multiplies the same per-diem activity by the 15 days that make up the second sub-period and then multiplies that activity total by the conversion factor from the set dated May 13th, 2018.
Pulling it All Together
Now that we've examined each step of the process of calculating reported results from raw activity data in nitty-gritty detail, it's time to pop up a level and see where we are. Refer to Figure 13 below:
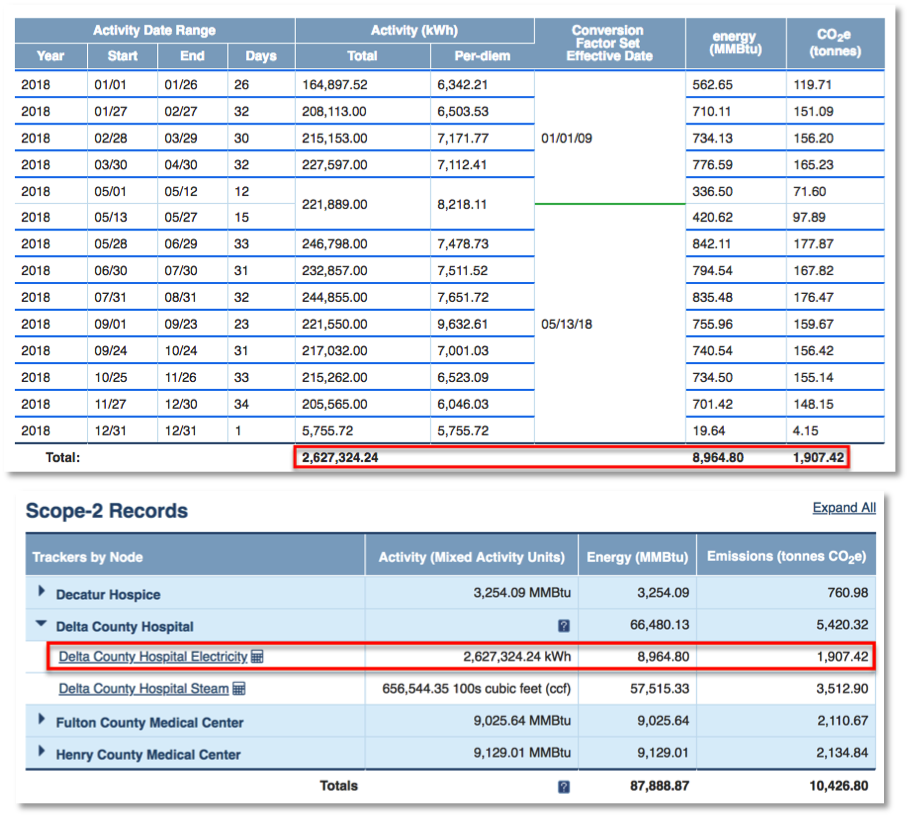
Figure 13 - The Audit Trail Confirms the Reported Results
This figure illustrates the excerpt from the report corresponding to the Delta County Hospital Electricity tracker (that we first saw back in Figure 8) alongside the audit trail window that the verifier uses to confirm the reported results. Looking at the highlighted rows in each, we see that the tracker's values for activity, energy and emissions incurred over the reporting period match the values in the audit trail window for the same tracker. We've seen how the audit trail window explains how each of these numbers are derived from the raw activity data entered by the user using date proration, the conversion factors in the Scope 5 resource library and standard unit conversion.
In this manner, the verifier can use the audit trail window to confirm the values in each of the report's tracker rows or to spot-check for a subset of the trackers. Having confirmed that each of the report's tracker rows are correct, simple addition of the values in the reports' tracker rows is sufficient to verify the reported totals.
The Trivial Case
Early in this article, we discussed the special case in which activity record dates are aligned with the reporting period and there are no changes in conversion factors during the reporting period. Here, we examine the (relatively streamlined) audit trail functionality as it would apply to this special case.
Aligned Activity Records
The activity ledger for Auckland Electricity illustrated below exemplifies the case in which activity records are annual and are perfectly aligned with reporting year boundaries.
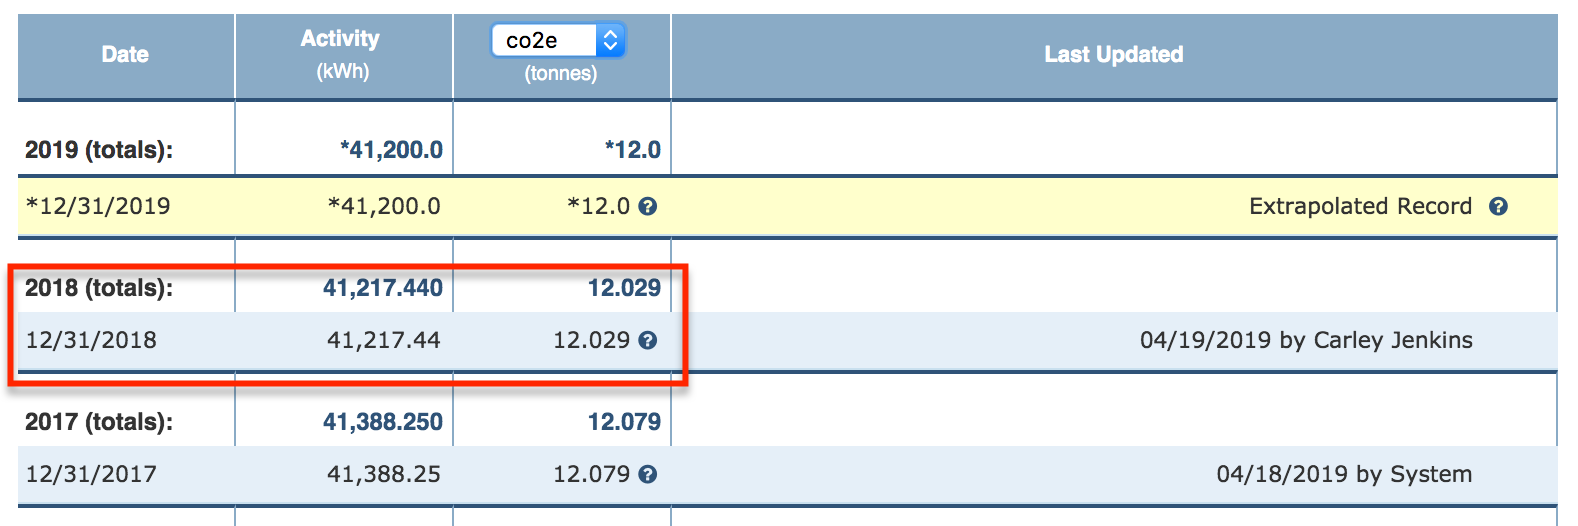
Figure 14 - The Activity Ledger for Auckland Electricity
We'll assume that the verifier is using audit trail functionality to verify a report generated with a reporting period that is calendar year 2018. In this case, the single activity record highlighted in the activity ledger in Figure 14 completely and perfectly quantifies the tracker's activity for the reporting period.
An excerpt from the report is illustrated below, in Figure 15.
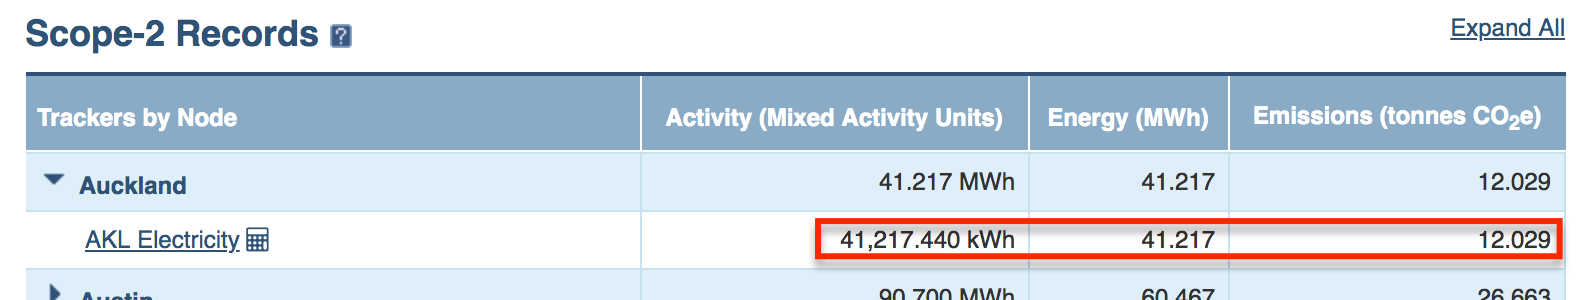
Figure 15 - The Report for 2018
Note that, because the activity record in Figure 14 quantifies activity incurred over the exact reporting period of the report in Figure 15, no prorating is required and the activity number in both the ledger and the report (14,217.44 kWh) match exactly. In this case, no audit trail functionality is required to verify that the activity quantified in the report correctly reflects the raw activity data entered.
Nonetheless, we'll use the audit trail functionality to confirm the calculated emissions so we might as well open it now to see how it treats the activity processing. Clicking on the calculator icon immediately to the right of the tracker name in the Scope 5 report will bring up the following audit trail window:
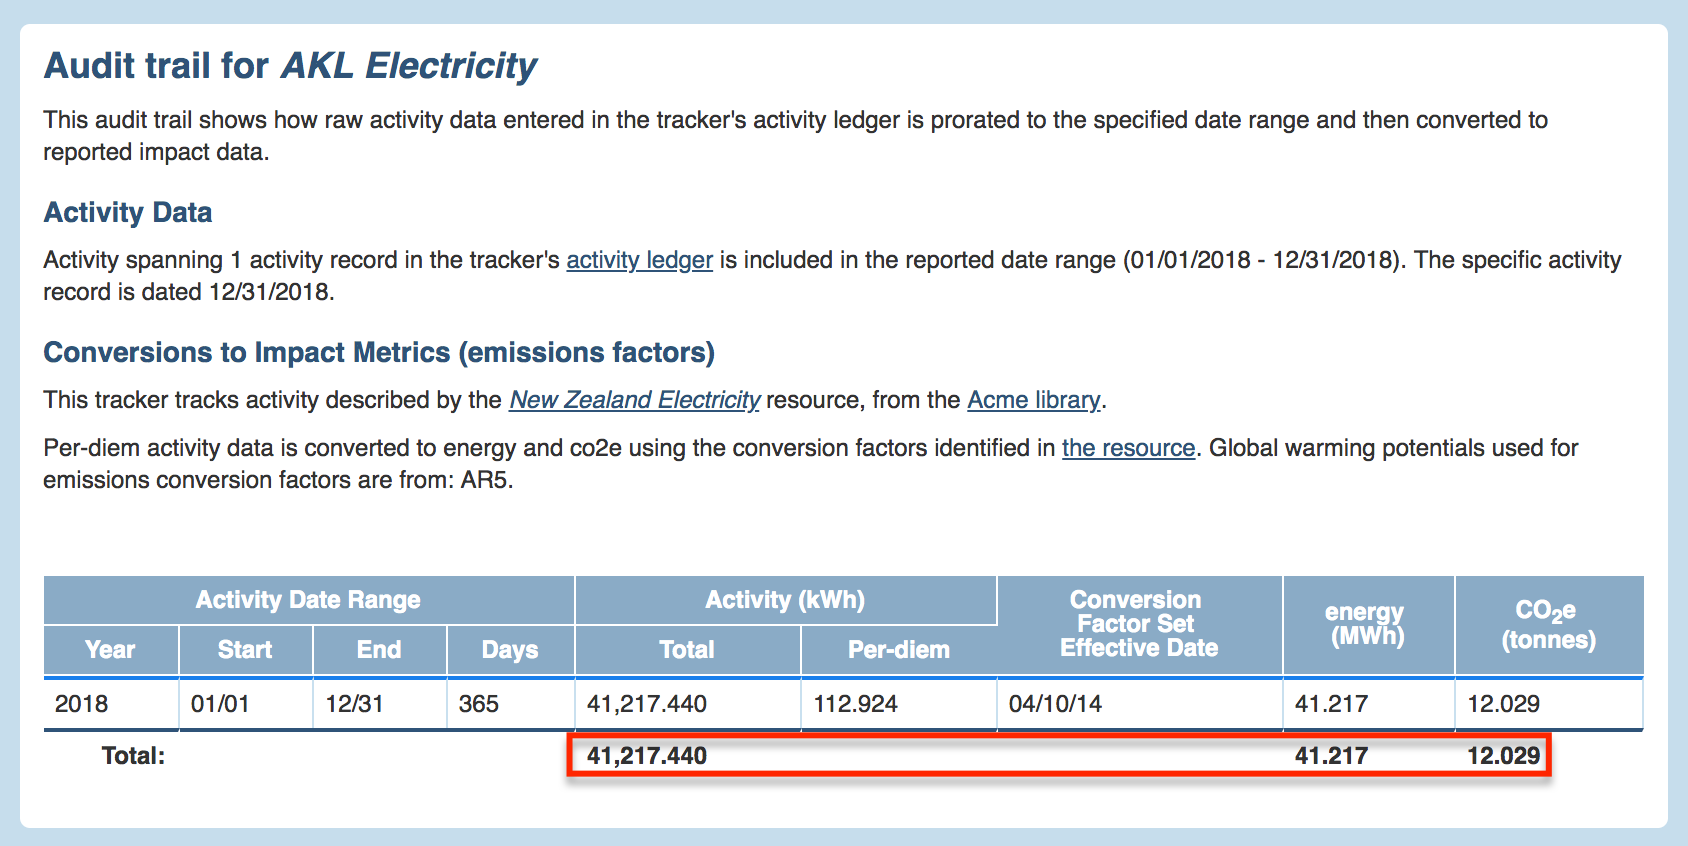
Figure 16 - The Simple Audit Trail
Indeed, the narrative under the heading Activity Data in the audit trail window confirms that a single activity record captures all activity data required for the report. The activity ledger hyperlink under the same heading makes it easy for the verifier to inspect the activity ledger for AKL Electricity. From the Activity Date Range columns in the bottom of the audit trail window, we can confirm that the activity record spans the reporting period dates of January 1st, 2018 to December 31st, 2018.
Conversion to Emissions
It's still necessary to verify that the emissions number reported (12.029 tonnes CO2e) correctly reflects the emissions generated by the activity. For this, we'll refer to the narrative under the heading Conversions to Impact Metrics in the audit trail window. From this narrative, we glean several useful facts:
- Conversions are performed using the New Zealand Electricity resource in Acme's library.
- Scope 5 uses the resource to convert activity to emissions.
- The global warming potentials used to calculate emissions come from AR5.
The verifier can follow the New Zealand Electricity hyperlink to inspect the corresponding conversion factors and verify that 41,217.44 kWh converts to 12.029 tonnes CO2e.
With that, the verifier has verified that the results tabulated in the report reflect the correct processing of the activity record entered in the activity ledger.
Exceptions
While the processing and audit trail functionality discussed in this article address most cases, there are several cases that it does not handle (or does not handle exactly as described). These are discussed here.
Averaging Trackers
Certain metrics are quantified using averaging trackers as opposed to summing trackers. Averaging trackers average the activity records in their activity ledgers (weighted by the corresponding activity period of each record). Averaging trackers are often used, for example, to track a facility's square footage. These kind of trackers are useful when energy use intensity (EUI) benchmarks are used to estimate emissions and energy for facilities for which the area is known but utility consumption is not.
In the common case that the reporting period spans one year and the EUI benchmarks indicate annual usage, Scope 5 produces the correct results for reporting purposes. The audit trail functionality is quite similar to the functionality described in this article but the reporter or verifier can expect to see slight differences. For example, the Total label in the audit trail table will be replaced by the label Average. In addition, the per-diem column is omitted from the table.
A sample table from the audit trail for an averaging tracker is illustrated below, in figure 17:
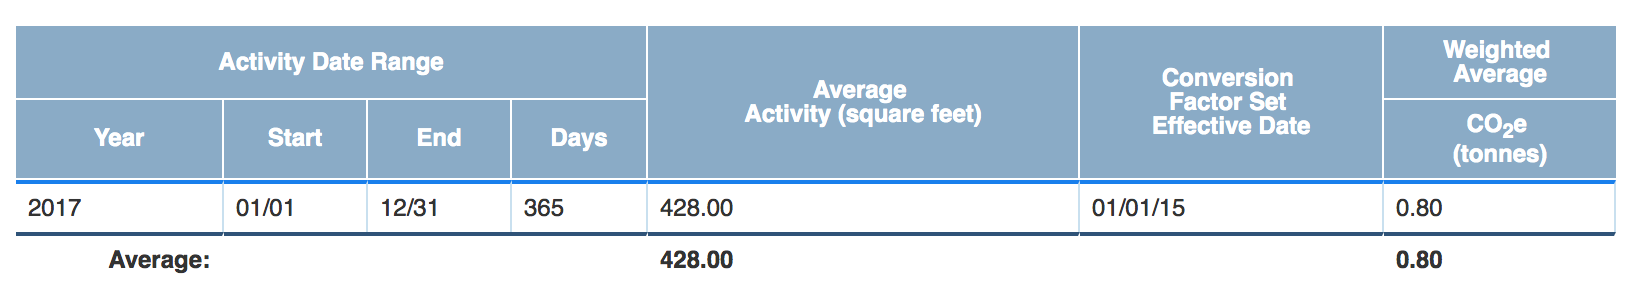
Figure 17 - Audit Trail for Averaging Tracker
The Energy Impact Metric
When an activity is measured in energy (such as electricity or therms of natural gas), energy is presented as one of the impact metrics that is converted from the activity data. This can be seen for example in the many illustrations of the audit trail window for the Delta County Hospital Electricity tracker. In rare cases, Scope 5 does use a resource that converts from the energy expressed as activity to a higher or lower energy amount and the energy calculation does indeed follow undergo the same conversion process as other impact metrics (using an energy conversion factor). However, in most all cases, the prorated energy value reported is either equivalent to the prorated activity reported or is expressed in different units but does not reflect an actual value conversion.
Dual-Reporting
Audit trails for dual reports document each calculated impact separately. The sample audit trail window illustrated in Figure 18 is for a dual report that shows both market based emissions and location based emissions (consistent with the Greenhouse Gas Protocol's Scope 2 dual reporting methodology):
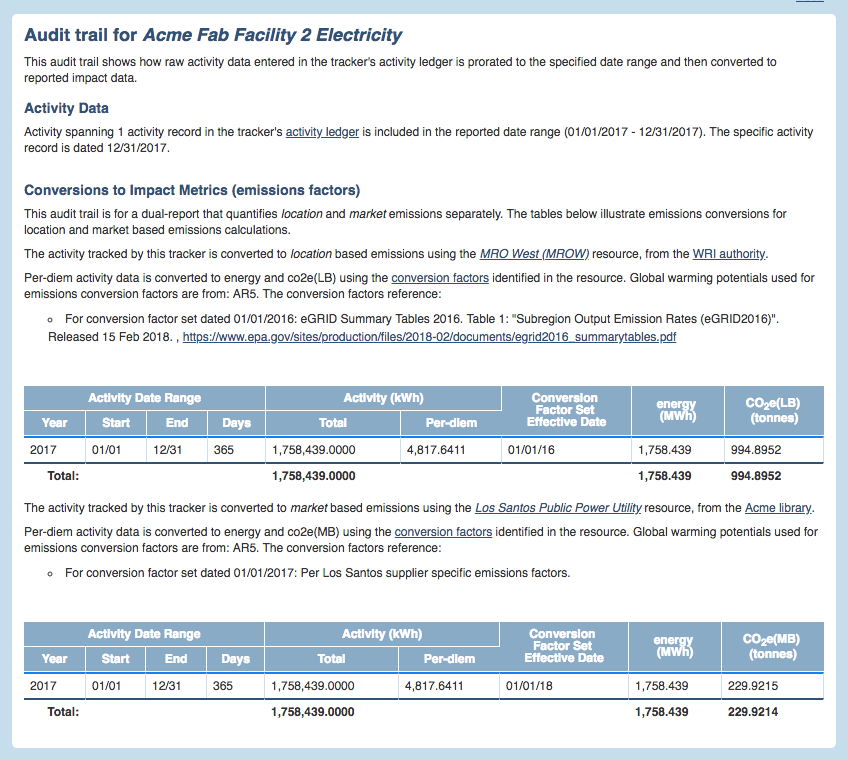
Figure 18 - Sample Dual Reporting Audit Trail
Intensity Metrics
Audit trail functionality is not currently fully functional for verifying reported intensity metrics.
Verifying Unit Conversion
Before ending this discussion of audit trail functionality, we'd be remiss if we did not point out the functionality in activity ledgers that can be used to quickly glimpse conversion factors and unit conversions that are applied to activity values. This functionality can be accessed in any activity ledger as illustrated in the examples below, in Figure 19:

Figure 19 - Activity Ledger Conversion Documentation
Two examples of activity ledger audit trail functionality are illustrated above. In one case, activity records will present a question mark icon adjacent to converted impact values in each activity record. This is the case when the activity ledger belongs to a tracker that points to a resource that has more than one conversion factor set. In the second case, the question mark icon will be presented once in the activity ledger's column heading for the impact metric. This is the case when the activity ledger's tracker points to a resource that has only one conversion factor set.
In both cases, hovering over the question mark will bring up an overly that lists all conversion steps, combining both unit conversion and the application of the conversion factor in the resource. In both cases, the conversion described amounts to a 'point' conversion in the sense that it's illustrating the conversion of the point value from the activity record's activity column and includes no proration. As such, while the unit conversion details in particular may be useful, these views are unlikely to be sufficient to explain completely the process that produced reported values from activity data.
Comments