
7.53 Did you have an emissions target that was active in the reporting year?
7.53.1 Provide details of your absolute emissions targets and progress made against those targets.
Scope 5 can be configured to track any absolute or intensity emissions targets. For details on long term targets and step-by-step instructions for configuring them in Scope 5, review this article in the Scope 5 Knowledge Base.
Starting in 2022, CDP requires per-scope reporting of multi-scope targets (e.g: scope 1 & scope 2 target has to be broken down into scope 1 target and scope 2 target). Additionally, the questionnaire pays special attention to Scope 3 emissions requesting a breakdown of target coverage by category in new columns. Hence, we recommend setting up scope-by-scope and category-by-category long term targets in the application along with your organization multi-scope targets (if applicable). If your organization has always set scope-by-scope targets, this will not impact your responses. After you've configured your long term targets in Scope 5, here are a few specific steps for filling in the CDP tables:
- Column 6, Year target was set, refers to the year in which your company has set the target.
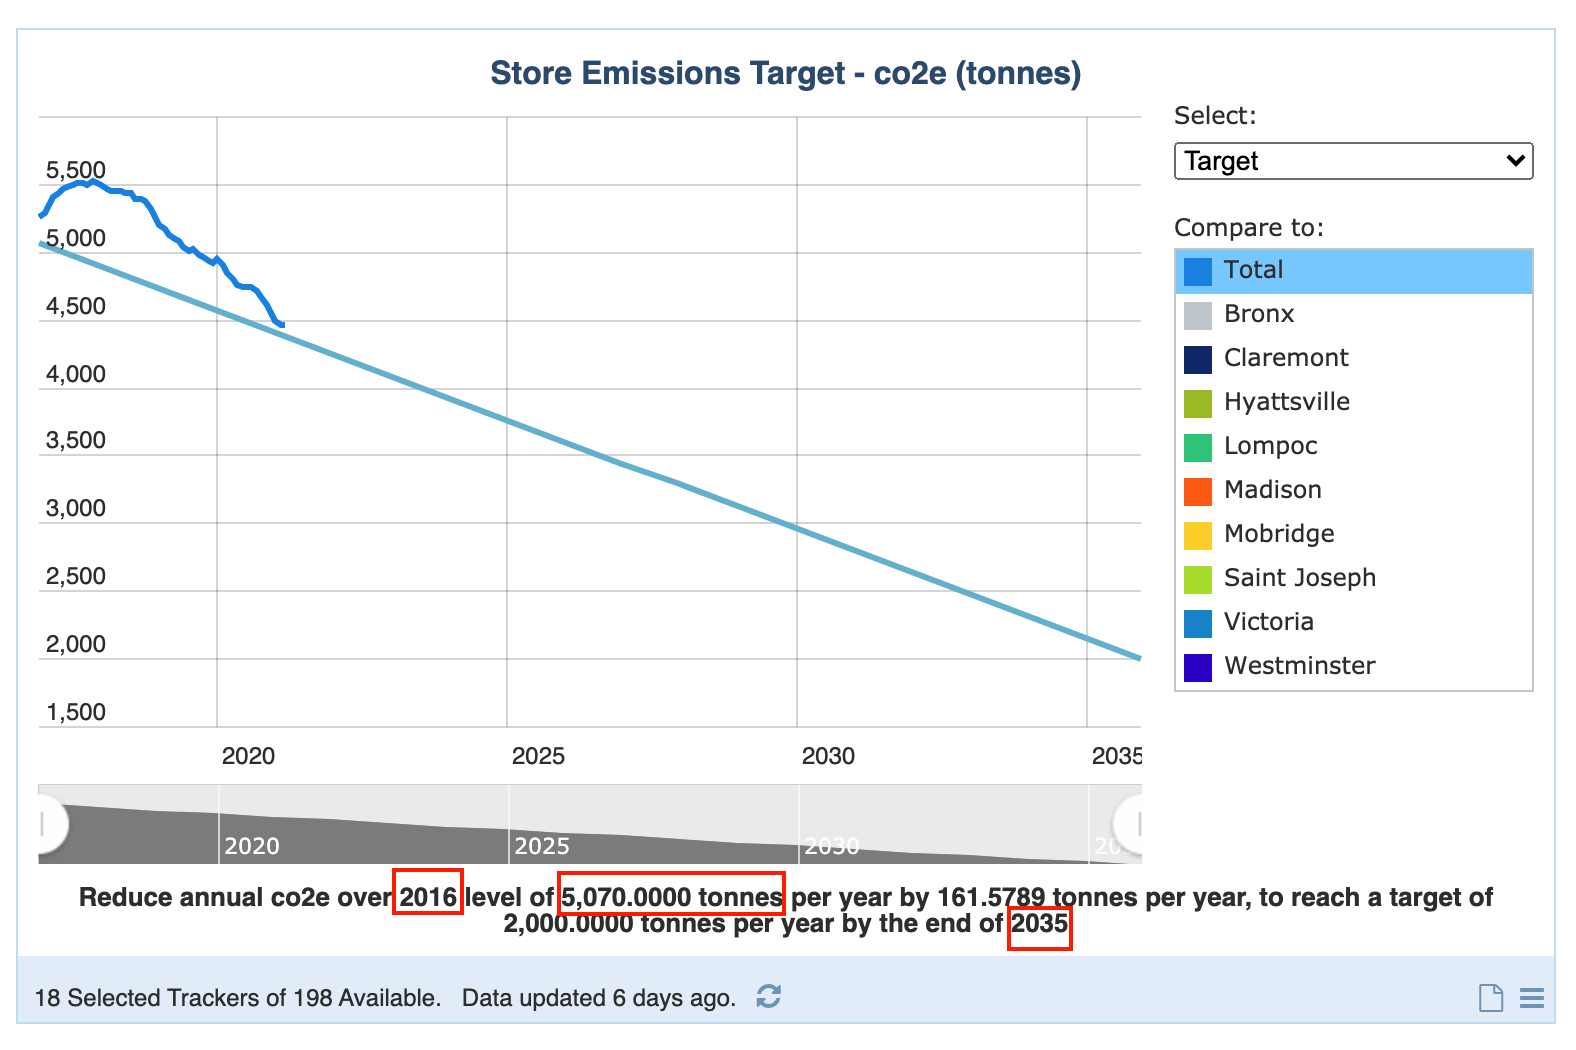
- Column 12, End date of base year, and column 55, End date of target year, can be found in the caption below the Long Term Target chart.
- Columns 13-32, Base year Scope X (Scope 3 Category [...] for columns 15-31) emissions covered by target (metric tons CO2e) asks you to "Enter the base year emissions covered by the target in this column." These values can be found by configuring your Long Term Target chart ‘Target Sub-Groups’ to Scope or Scope 3 Categories Tag Group for columns 12-28.
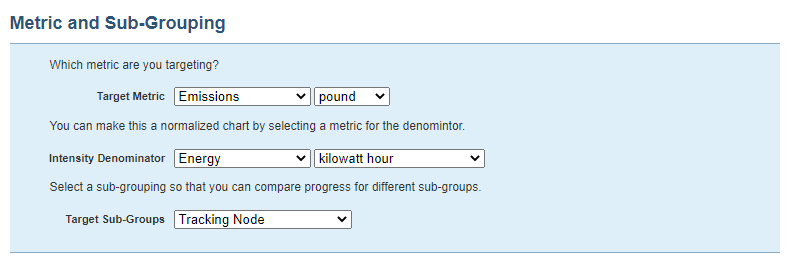
- Selecting the Year-By-Year option under ‘Metric and Sub-Grouping’ can make this value easy to find hovering over the trendlines on the Long Term Target chart.
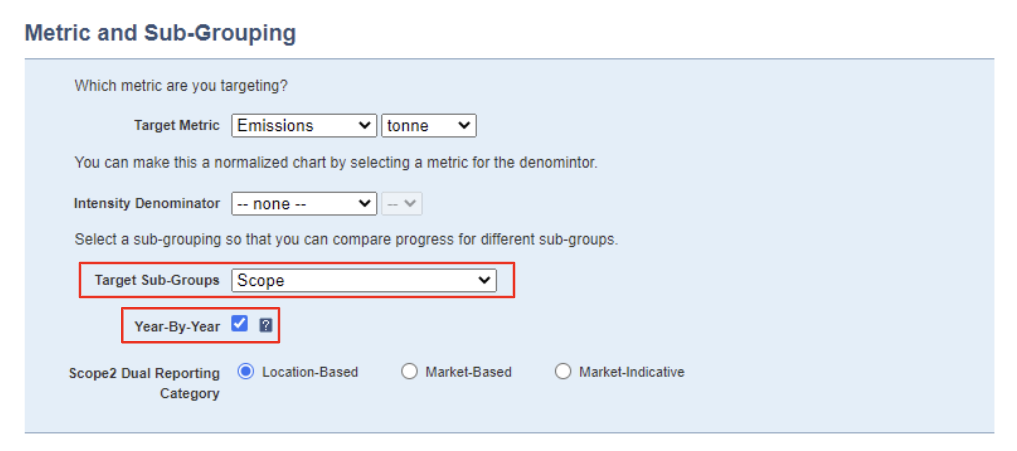
- Once configured to the intended grouping, find the base year emissions by hovering over the start of the trendline (representing the base year) that corresponds to the scope or category of interest.
- Column 33, Total base year emissions covered by target in all selected Scopes (metric tons CO2e) can be found in the caption below the Long Term Target chart or by hovering over the start of the trendline.
- Columns 34-53, Base year emissions by Scope X/Scope 3 Category covered by target as % of total base year emissions in Scope X asks you to enter the covered emissions in base year as a percentage of your total company-wide base year emissions in the scope or category your target relates to. If you included every in-scope tracker in your target (e.g: each and every scope 1 tracker), you can answer 100% to this question. Otherwise, to determine this in Scope 5, generate a base-year column intensity chart (separate from your long term target chart) on your main dashboard following these steps:
- For primary trackers, select the same set of trackers as the ones included in the long term target.
- For Cluster Data By, select - None - .
- For intensity trackers, select all of the trackers in the scope(s) that apply to your target and correspond to the Scopes or Categories of interest in that column. (For example, if your target is to reduce Scope 2 emissions arising from your Asian operations, select the Asian operations trackers as your primary trackers and all Scope 2 trackers as your intensity trackers.)
- For Normalizing Grouping, select - None - .
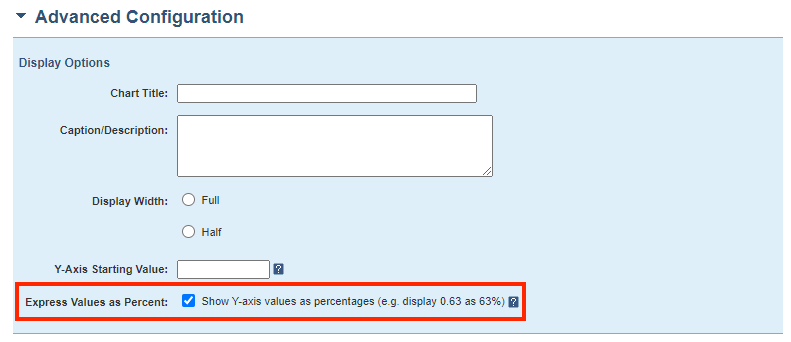
- In the Advanced pane, click the check box next to Express Values as Percent.
- In Column 54, follow the previous steps making sure to select all trackers (of every Scope) covered by your target to produce the base year emissions covered by target in all selected Scopes.
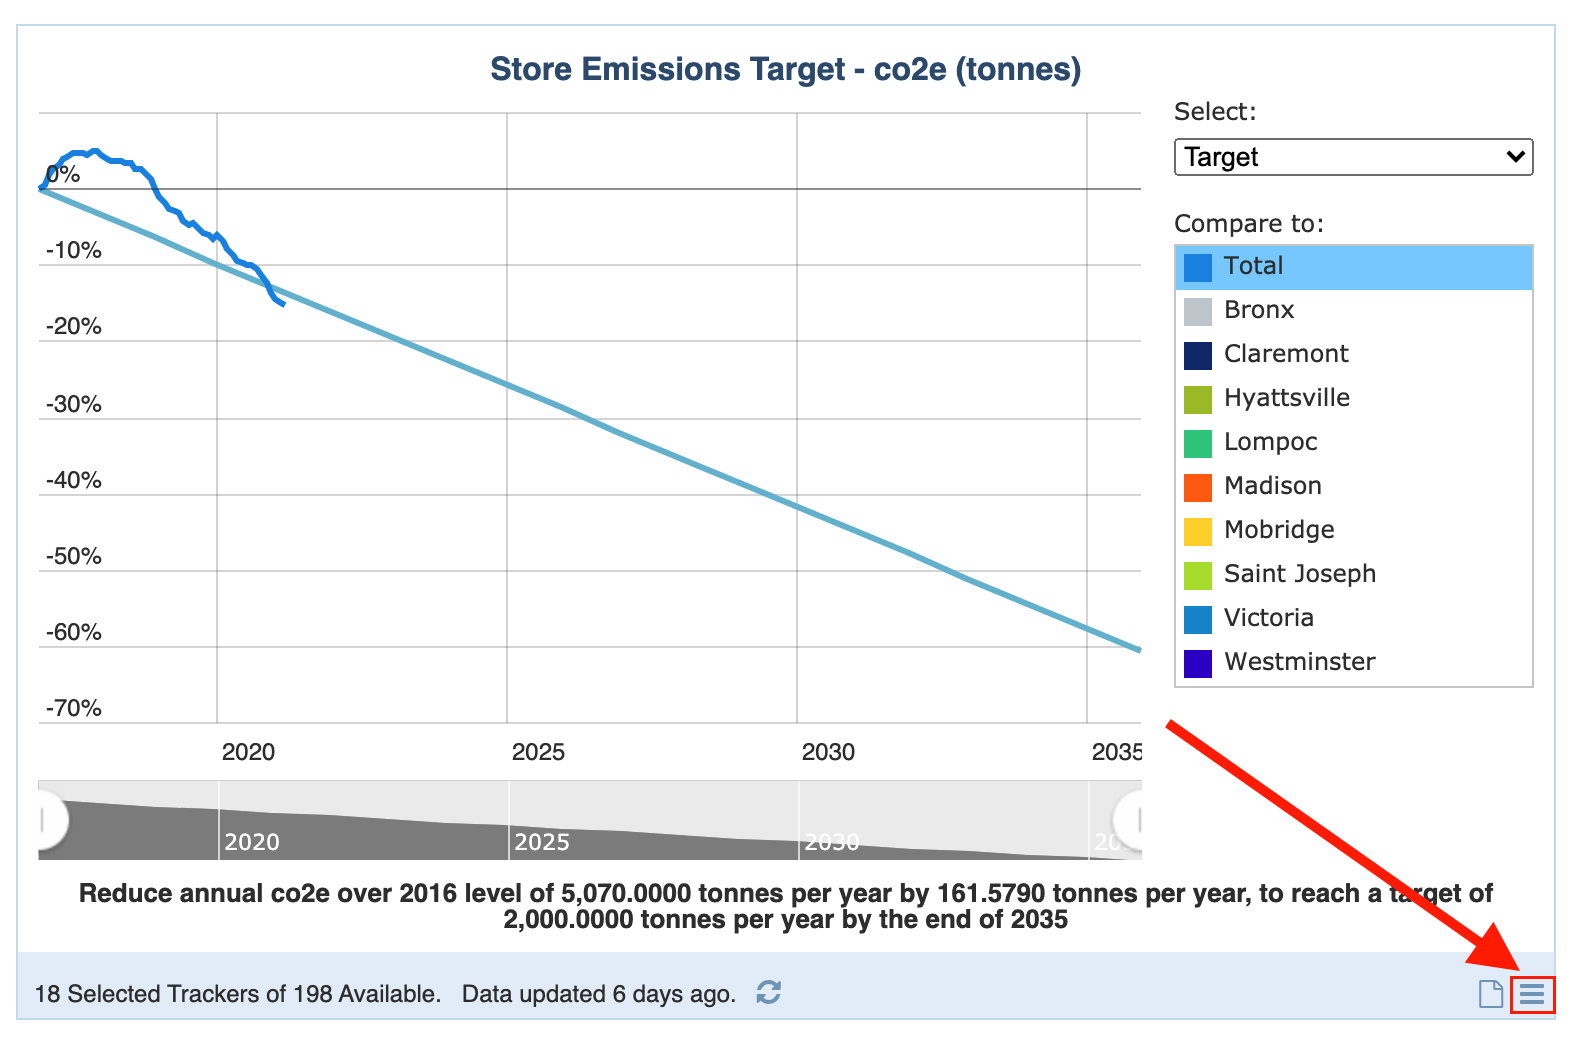
- Column 56, Targeted reduction from base year (%), asks you to "enter your emissions reduction targets as a percentage reduction of emissions to be achieved in the target year when compared to the base year." This is defined in the Set Reference & Parameters page in Long Term Target creation. Once generated, the percentage value view of the long term target chart will show the percent reduction (or increase) along the y-axis. You can switch between the percentage value and absolute value views by clicking on the icon in the bottom right corner of the target chart.
- Columns 58-76, Reporting year emissions by Scope X/Scope 3 Category covered by target (metric tons CO2e) can be determined by following the steps for Columns 13-32, and hovering over the reporting year instead.
- For Column 77, make sure to select all trackers of every Scope/Scope 3 Category covered by the target to represent Total emissions in reporting year covered by target in all selected scopes.
7.53.2 Provide details of your emissions intensity targets and progress made against those targets.
For details on intensity charts, please use this knowledge base article or contact us for help.
To answer 7.53.2, follow the instructions for 7.53.1, with three additional columns to answer to:
- Column 12, Intensity metric, asks you to select which intensity metric you're charting from a drop-down select. We recommend adding the intensity metric to the title of the Long Term Target (such as "Reduce Emissions per unit of production by 20% (ton/unit)") so that answering this question will be easy. To identify which particular units are charted, edit the chart and find the Target Metric and the Intensity Denominator.
- Column 59, % change anticipated in absolute Scope 1+2 emissions, asks you to "enter the percentage change in your total absolute gross global Scope 1+2 emissions anticipated, based on the information provided in the previous columns."
- Column 60, % change anticipated in absolute Scope 3 emissions, asks you to "enter the percentage change in your total absolute global Scope 3 emissions expected, based on the information provided in the previous columns."
Comments