
What is a Long Term Target?
In Scope 5, long term targets can be used to set targets for activity, cost, energy or emissions. Examples of long term targets include:
Reduce annual emissions by 25% over 2012 levels by the year 2025.
-- and --
Reduce annual energy use by 112,000 BTU per year over 2012 levels by the year 2030.
Long term targets have:
- A base year or reference year - In both of the examples above, the reference year is 2012.
- A quantified reduction, in percent or absolute amount - from above - 25% or 112,000 BTU.
- A target year - in the examples above these are 2025 and 2030.
- A target amount that will be reached in the target year - Scope 5 will automatically derive the target amount from the other target parameters.
Long term targets are typically reached over a period of years. Long term targets can be used to set Science Based Targets.
Long term targets should not be confused with the related but different, short term target functionality.
Typical Workflow
To work with long term targets, you must have the Projects module enabled for your account. Projects, forecasting and long term targets are all related. Typical workflow is:
- Set a long term target.
- Design a group of projects that will help you achieve your target.
- Define the quantitative impact you expect those projects to have.
- Forecast the impacts of combinations of projects to see how and when you will achieve your target.
Creating a Long Term Target
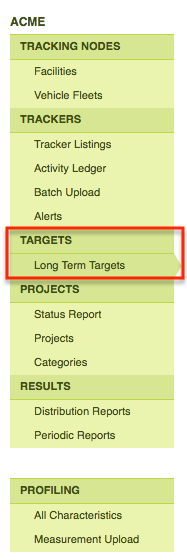
Use the Long Term Targets button in the side nav to access the target functionality:
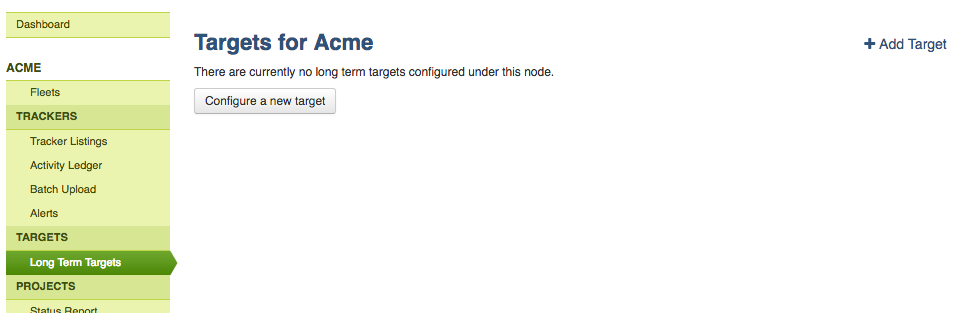
You'll be taken to the long term target index page. If any long term targets have been created under the current node, they will be listed on and accessible from this page. If there are no existing targets, you will be invited to create one:
Clicking to create a new target will bring up the dialog box illustrated in the screenshot below. Start by naming and describing your target. In the next section of the dialog box, you'll see the familiar tracker selection tool. Select all the trackers that should be included in the scope of the target that you're creating.
In this example, we're creating a target for all scope 1 and 2 emissions, so we'll include filters for those scopes and click the Apply Filters button: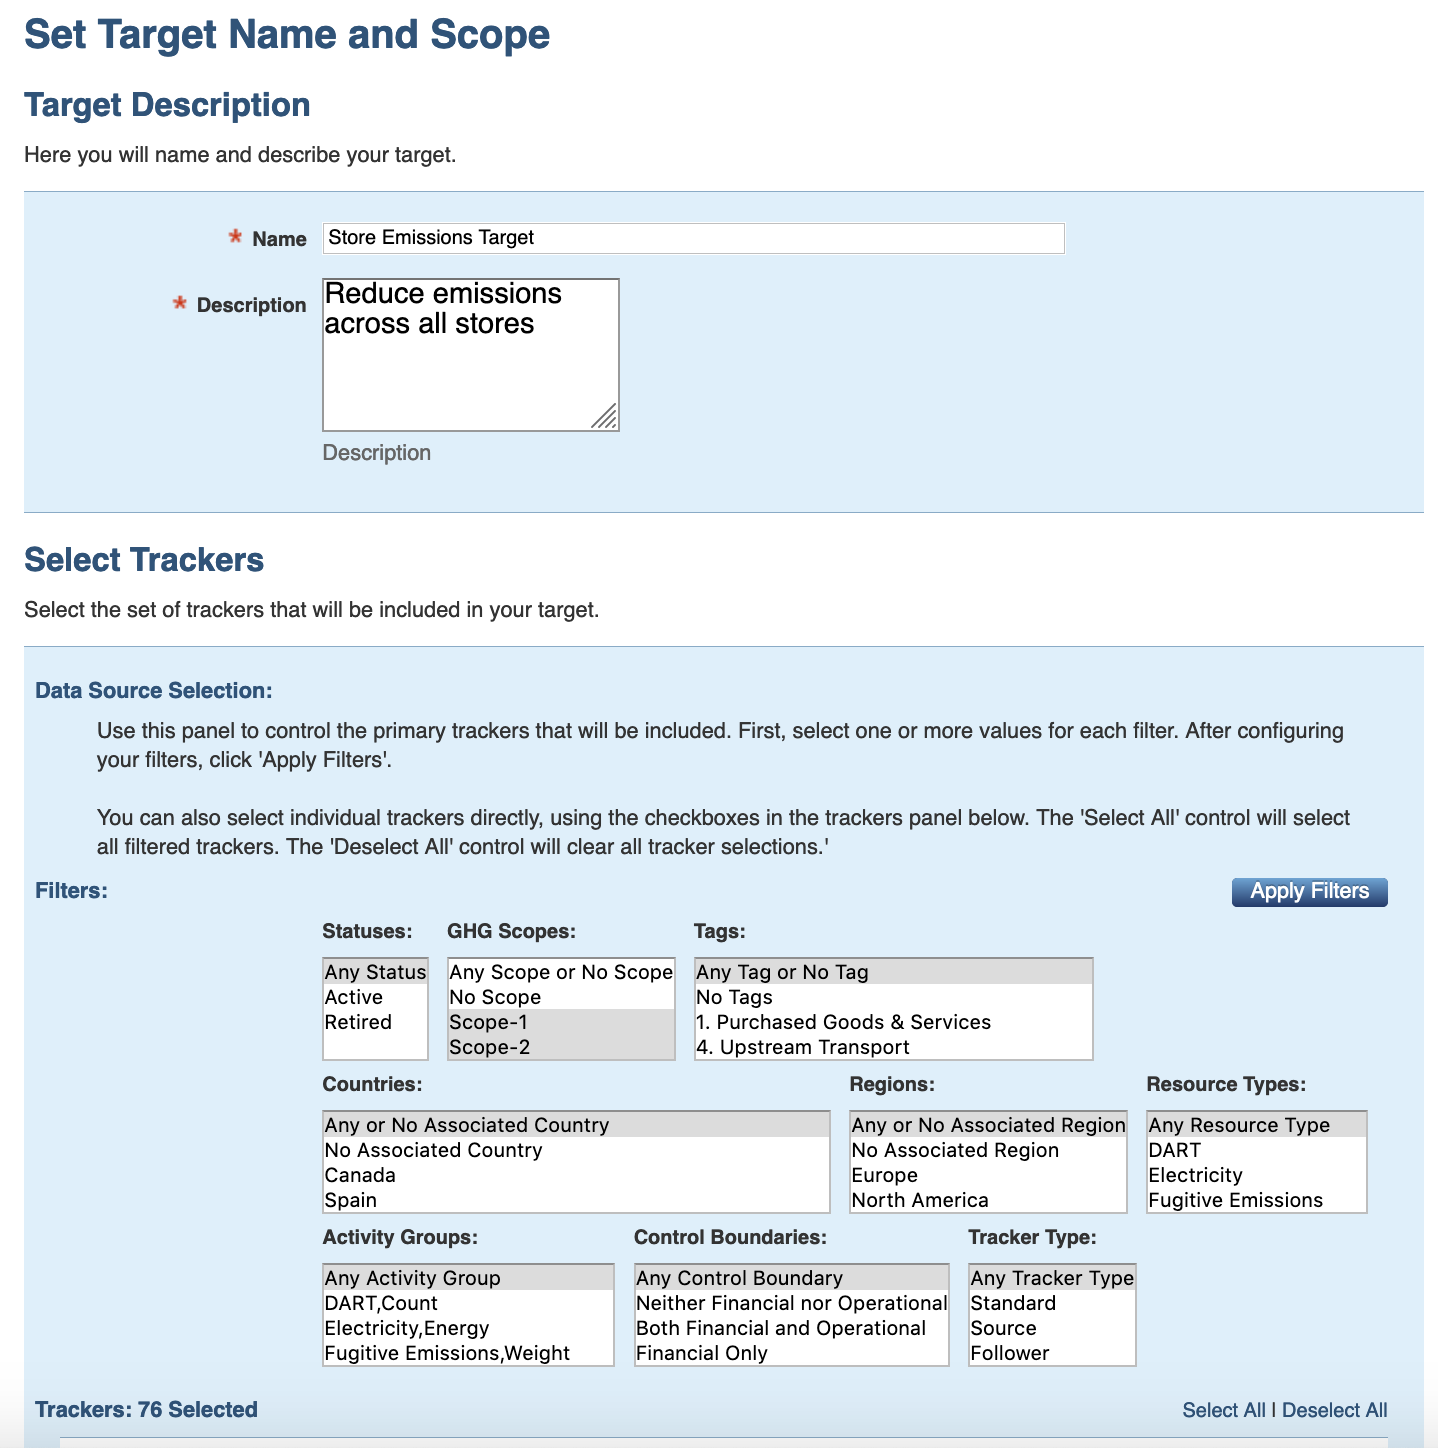
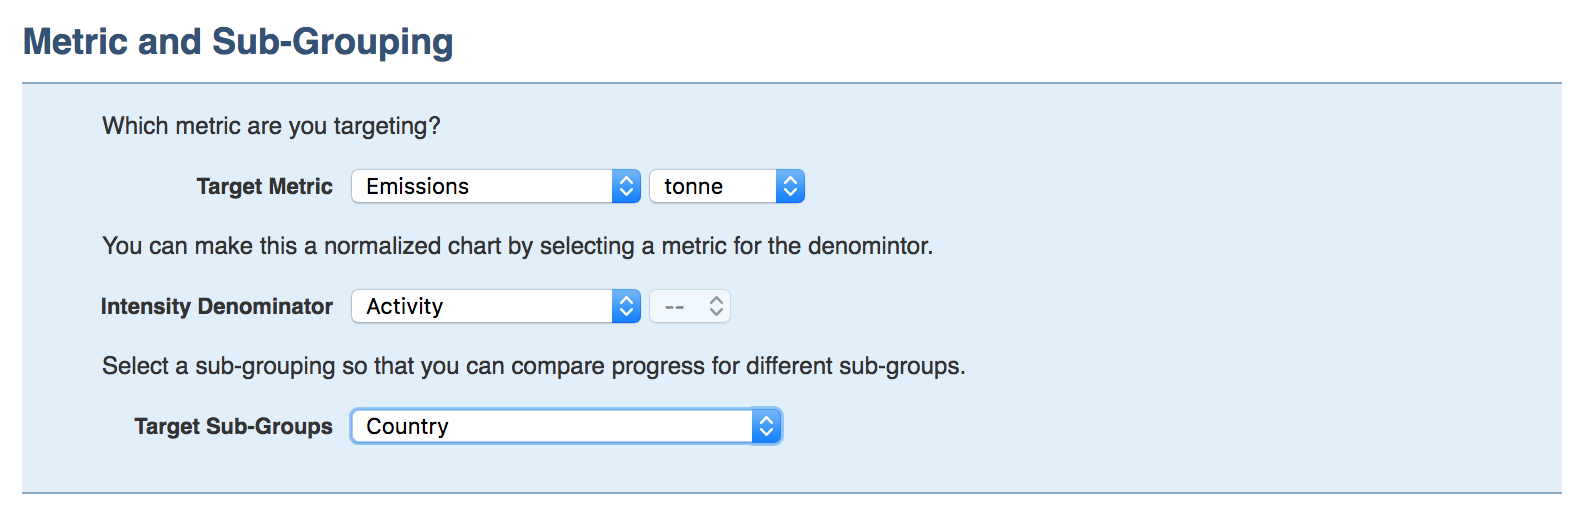
Next, select the metric that you want to target. If you'd like to set an intensity target, expand the Normalizing Trackers pane directly above an then define the Intensity Denominator. (For details on normalizing by tracker and intensity reporting, review this article.)
Then, decide how you would like to Sub-Group the trackers that are part of the target. The sub-grouping will make it easy for you to segment the selected trackers into groups (by location, resource type, GHG scope, etc.) so that, over time, you can see which groups are helping you reach your target and which groups are making it difficult to reach your target. The sub-grouping can be changed at any time.
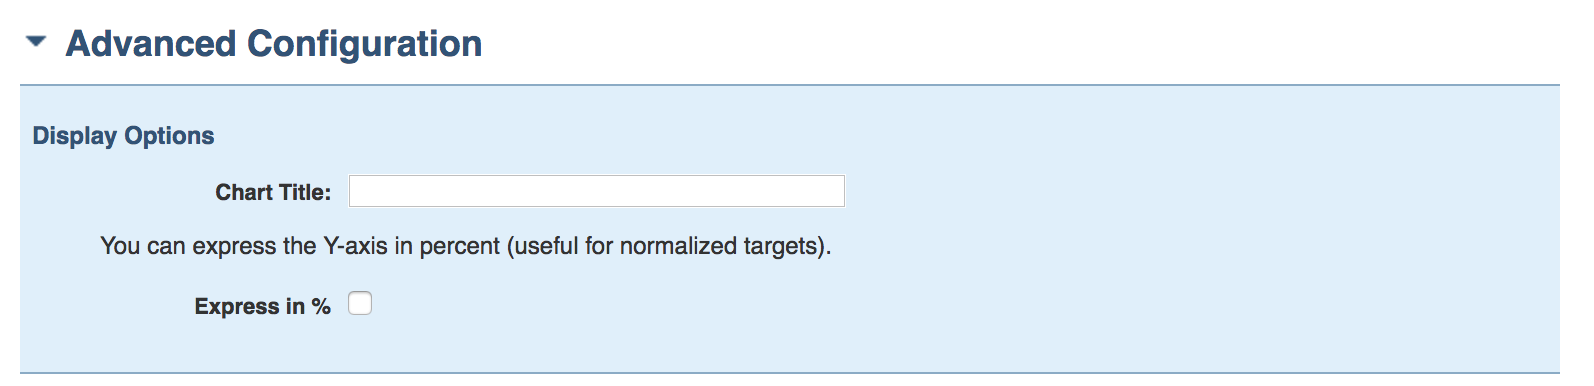
If you would like to give the target chart a custom name or display the x-axis values in percent, expand the Advanced Configuration pane:
Finally, click the Continue button at the bottom of the page.
Setting the Target Trend Line Parameters
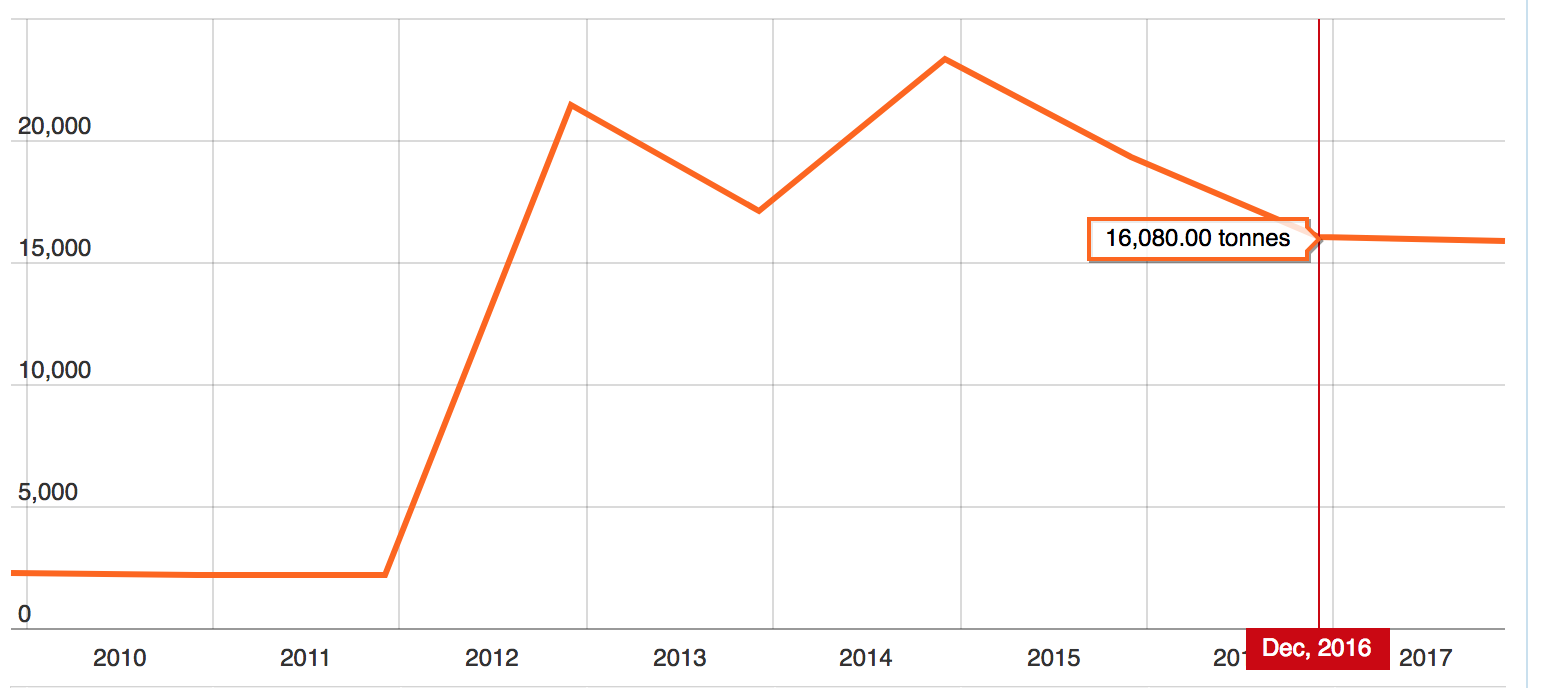
Next, you'll be presented with a trend chart showing the annualized rate (on a 12-month running average) of the metric you are targeting, from your account's baseline date, through the present. If you hover over the trend line, you can see the exact value of the metric for different years. When you're ready, click on the chart to select the target reference year and starting value.
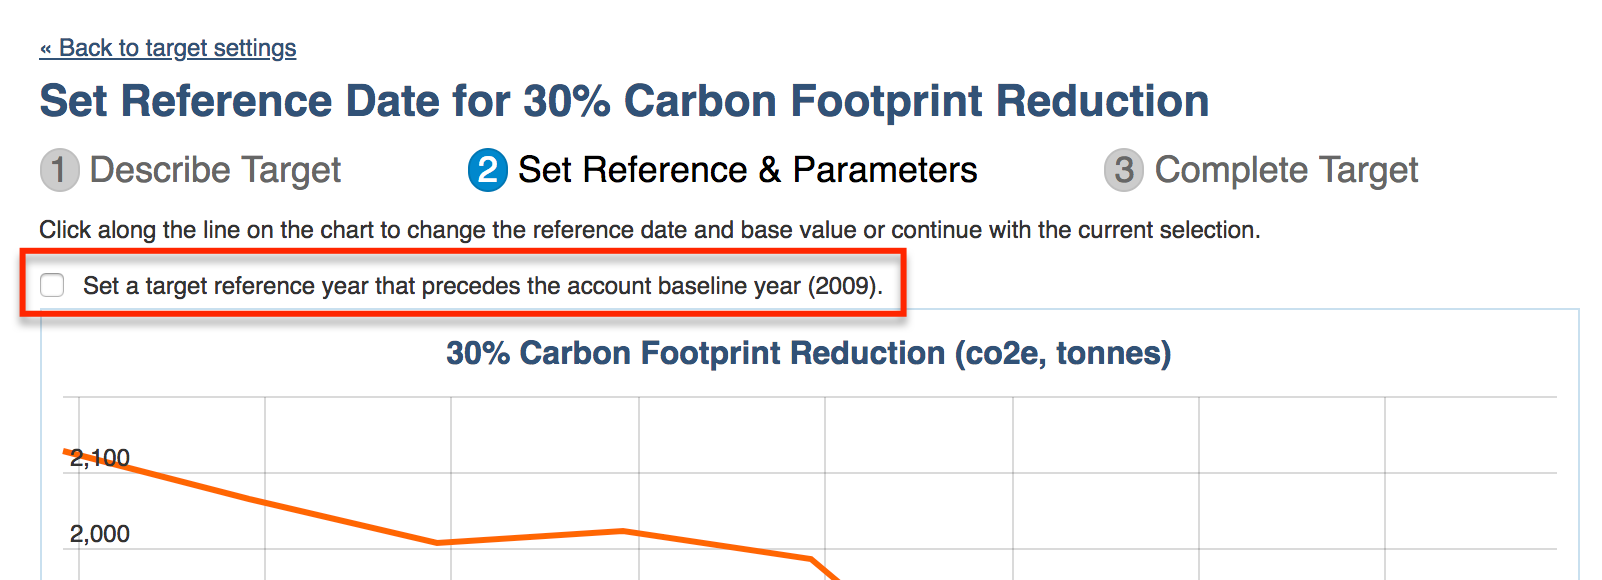
Alternatively, set a target reference year that precedes the account baseline year by clicking the check box:
As soon as you click on the charted trend line (or fill in your target reference year prior to the baseline), the Define Target dialog box will open immediately under the chart. The base year and starting value will be determined based on your previous selection.
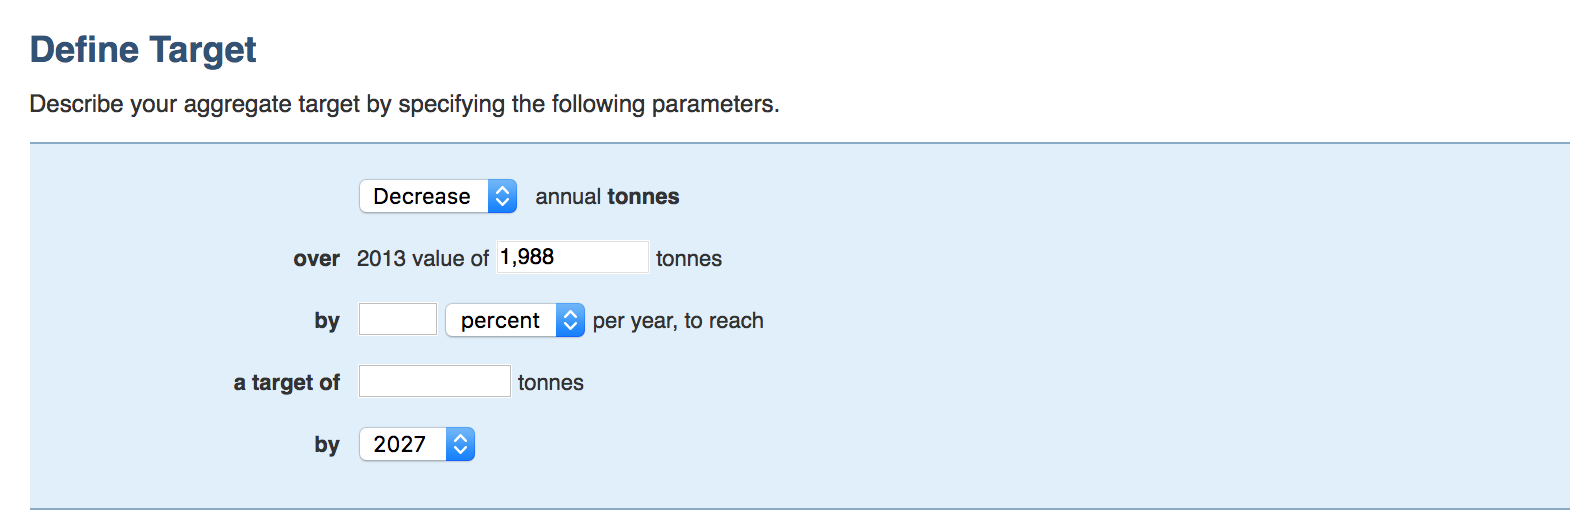
Select a target year (the last drop-down select in this pane) to specify when you'll ultimately reach your target.
Next, choose if you are targeting an increase or a decrease in the first drop-down select in the pane. Then, define if you're setting a reduced target rate or a reduced target amount by choosing either percent (for a rate) or your target metric (for an amount) from the second drop-down select.
Then either fill in the box next to the percent/metric drop-down select, or fill in the box following a target of. Based on your entry in either field, Scope 5 will automatically adjust the other field so they are compatible. Take the time to play with the numbers here to see just how they affect each other. When you're done, save the trend line parameters by clicking the Continue button at the bottom.
Viewing and Analyzing Your Target
You'll be taken to a chart that shows the target trend line, starting at the baseline date and ending at the target date. The actual total will also be illustrated (under the label Total). The actual will only extend as far as you have actual data loaded into Scope 5. In this example, the baseline year is 2013 and data is available for much of 2014, so we can see how we've been trending toward our target during the first 11 months or so.
Remember that you can hover over the trend lines with the cursor to see exact data points. From the chart, we can see that while the actual energy use has been reduced in 2014, it has not been reduced by the 10% targeted.
Select any or all of the sub-groupings from the table on the right to see how they are each trending. This is demonstrated in the next illustration. Note that we've used the 'ear' on the overview strip at the bottom of the chart to 'zoom in' on a few years following the baseline.
From this chart, we can see that the Scott Electricity NG010001 tracker has been hindering our progress toward the target. The 4102-1185 account, on the other hand, is right on target.
Click Save whenever you're ready.
So the Target is Set - What Now?
Once the target is created, you can monitor progress against it over time. You can change the sub-groupings or the target parameters at any time using the links above the chart. You can also use the re-create target link to delete the target and create a new one.
Comments