
7.5 Provide your base year and base year emissions.
Base year:
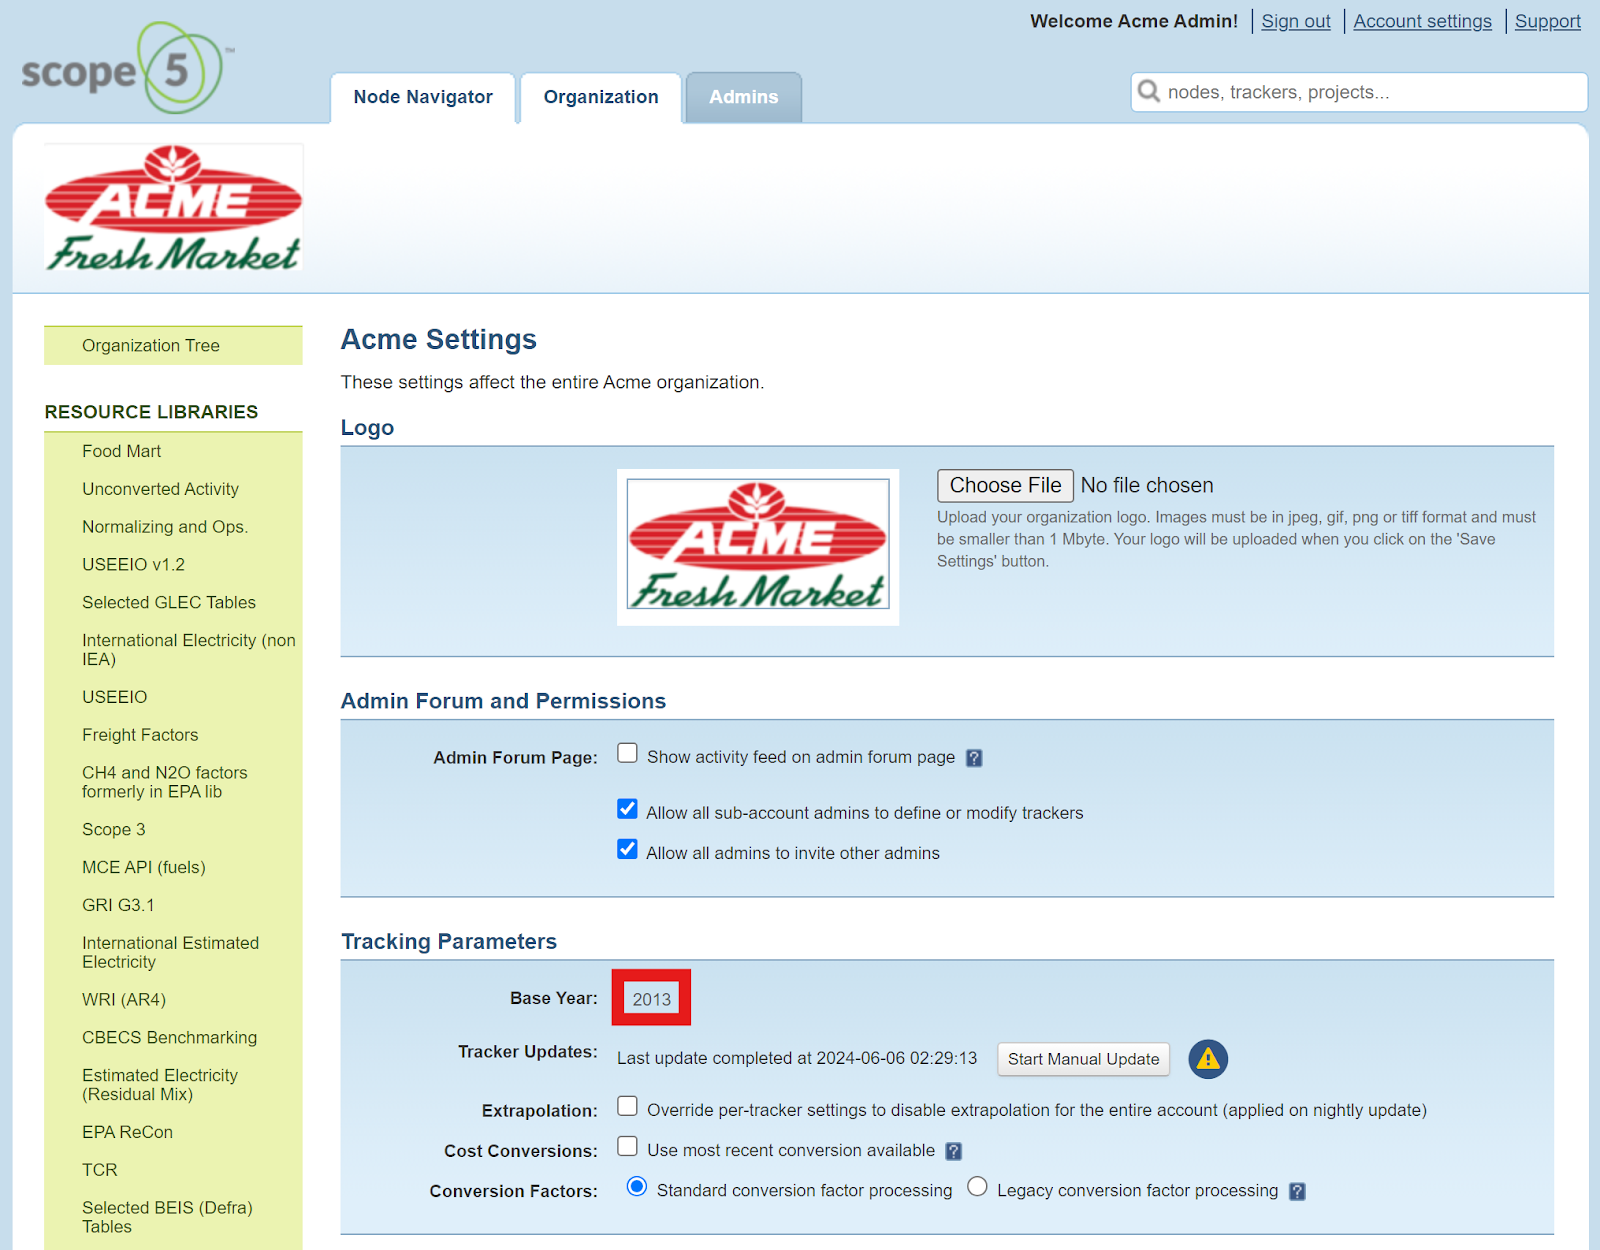
1. Decide what year you will be considering your base year for the purpose of CDP reporting. It may or may not be the same as your Scope 5 base year. Your Scope 5 base year can be found in the Preferences & Settings dialog box which is accessible under the Organization tab.
Base year emissions - Scope 1 & 2
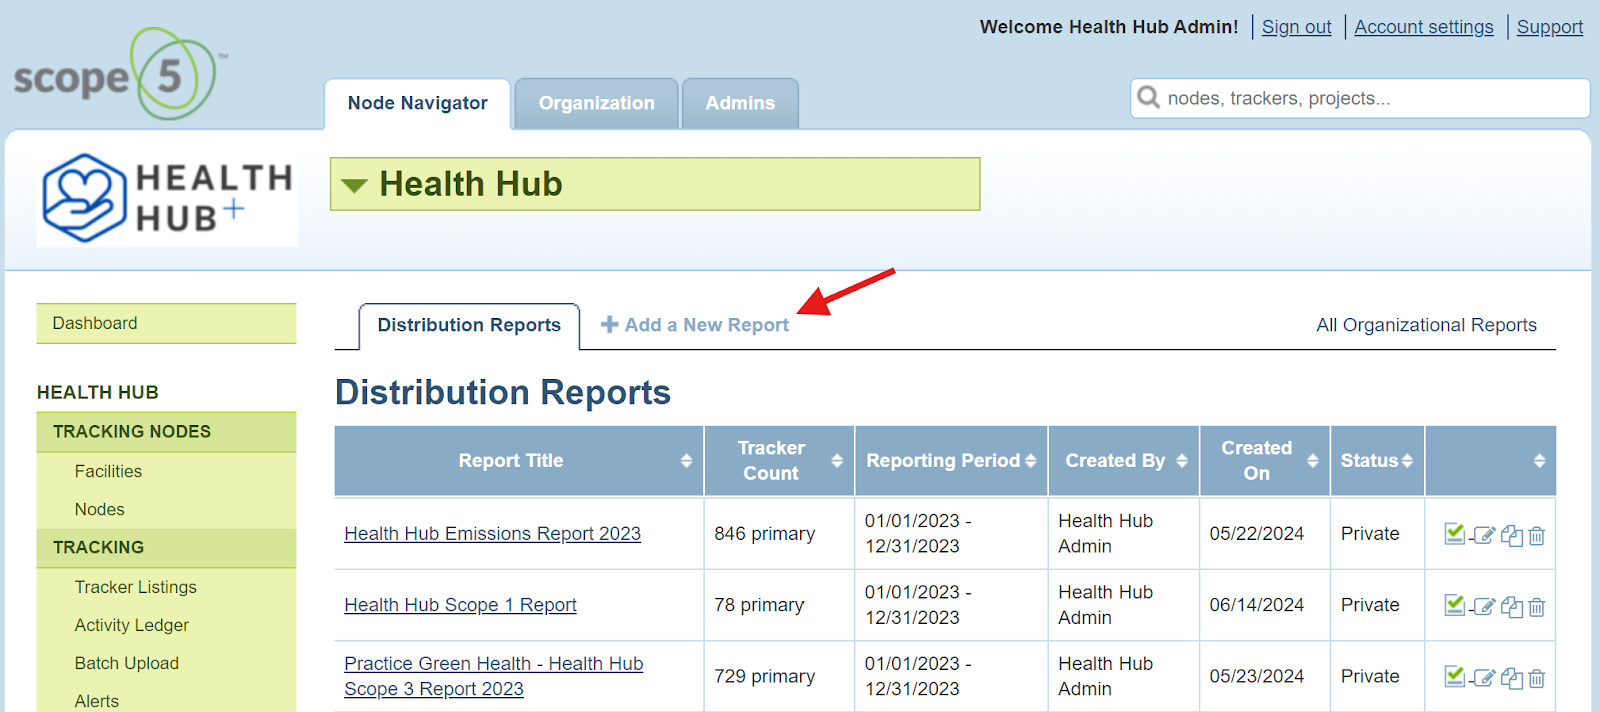
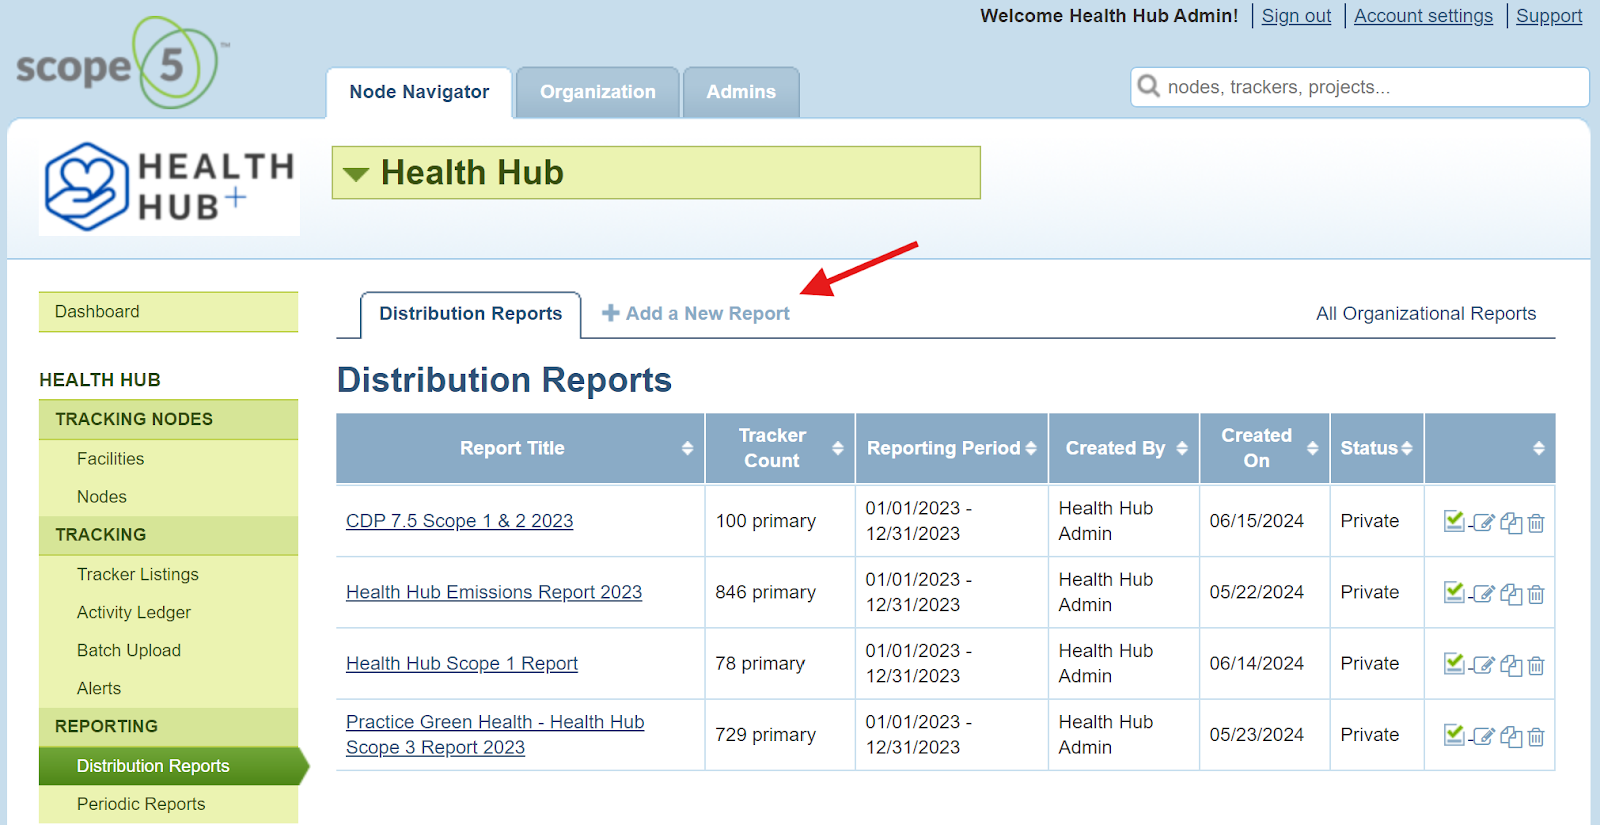
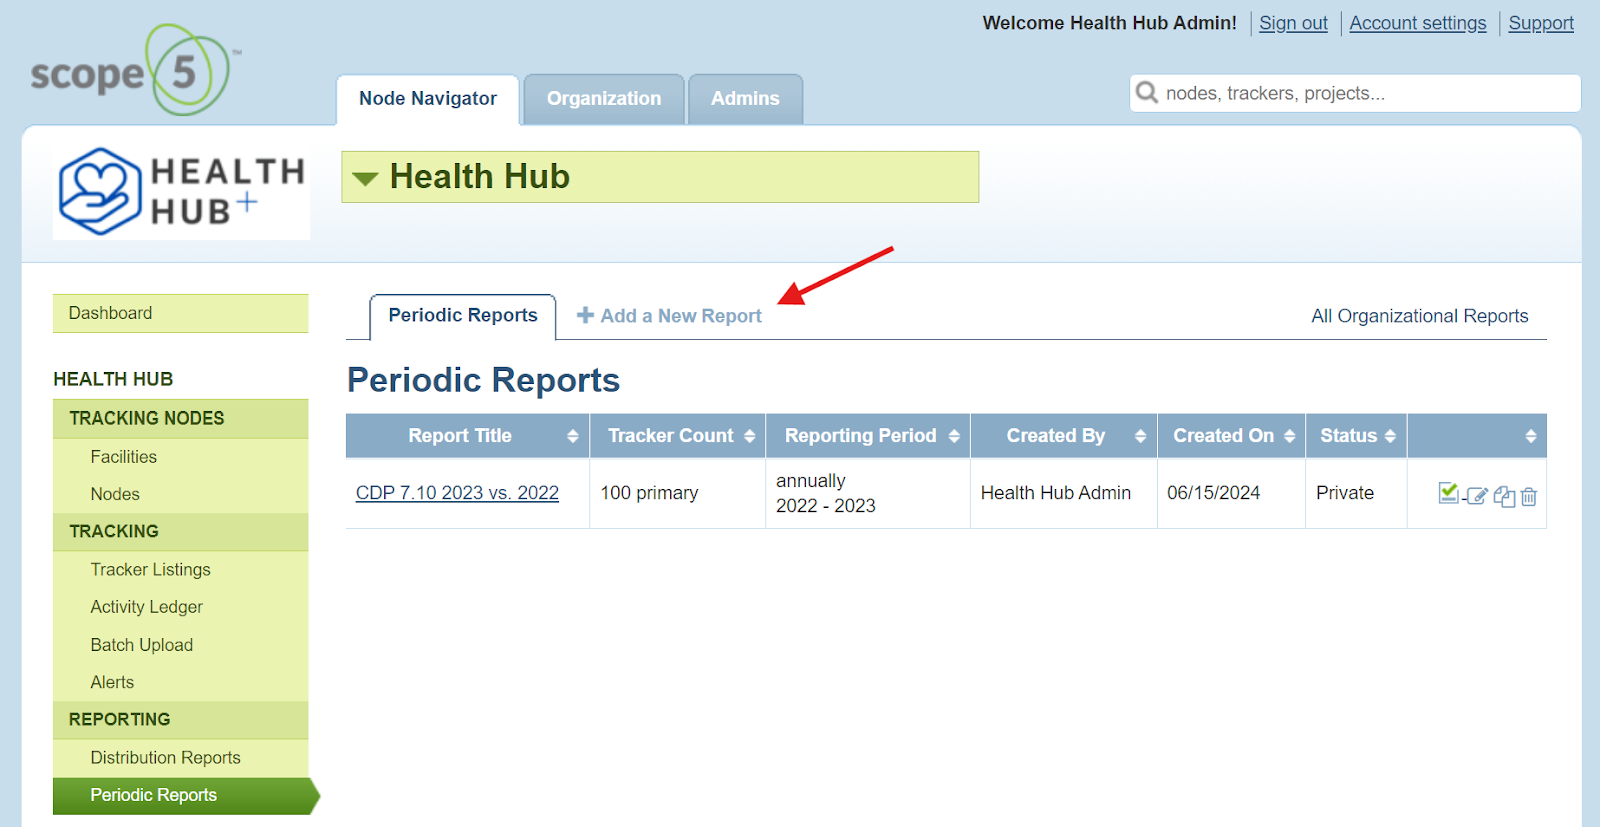
1. From the top level of the Node Navigator, select Distribution Reports.
2. Click Add a New Report.
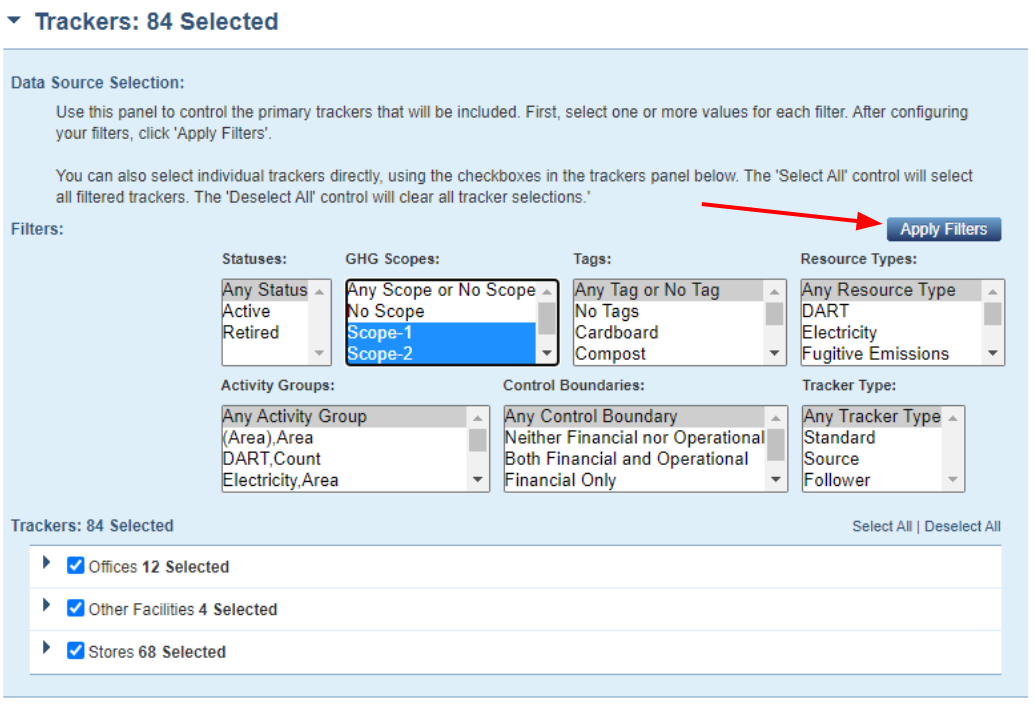
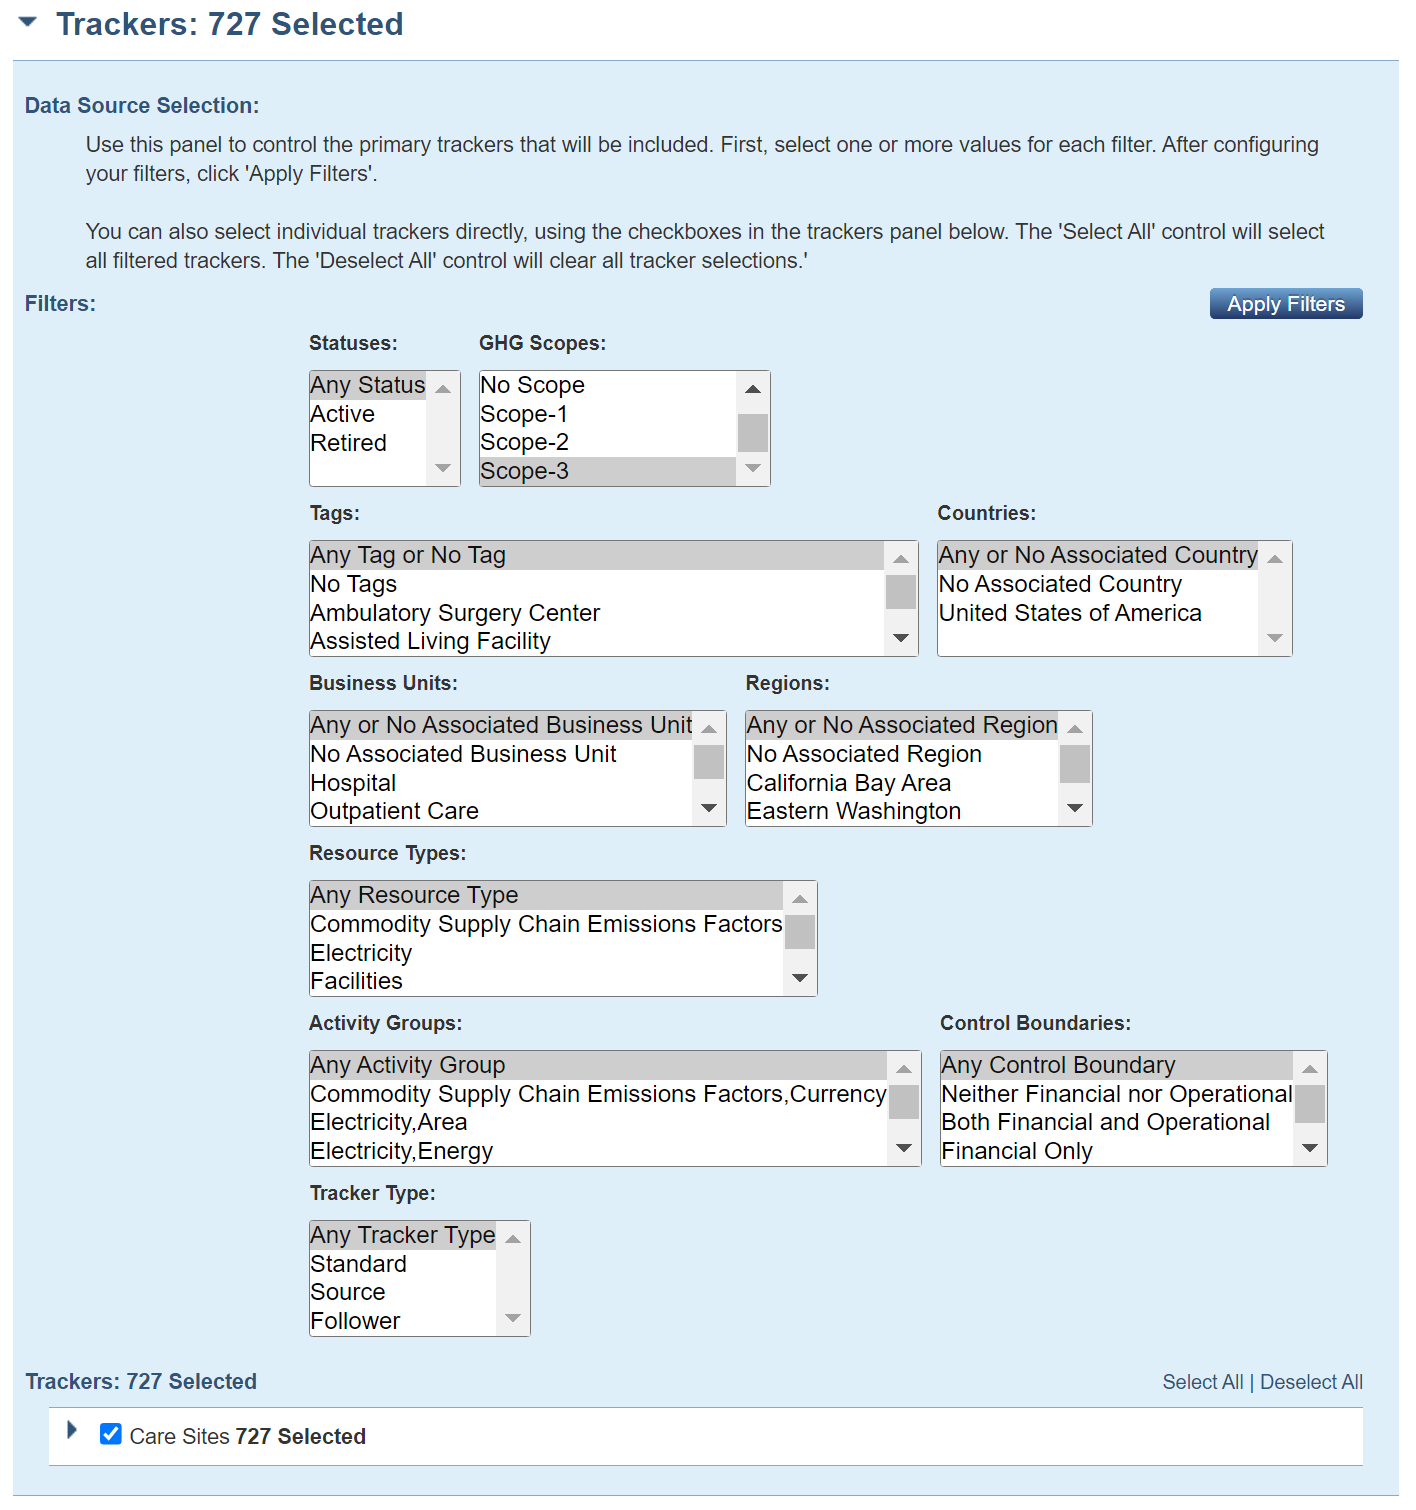
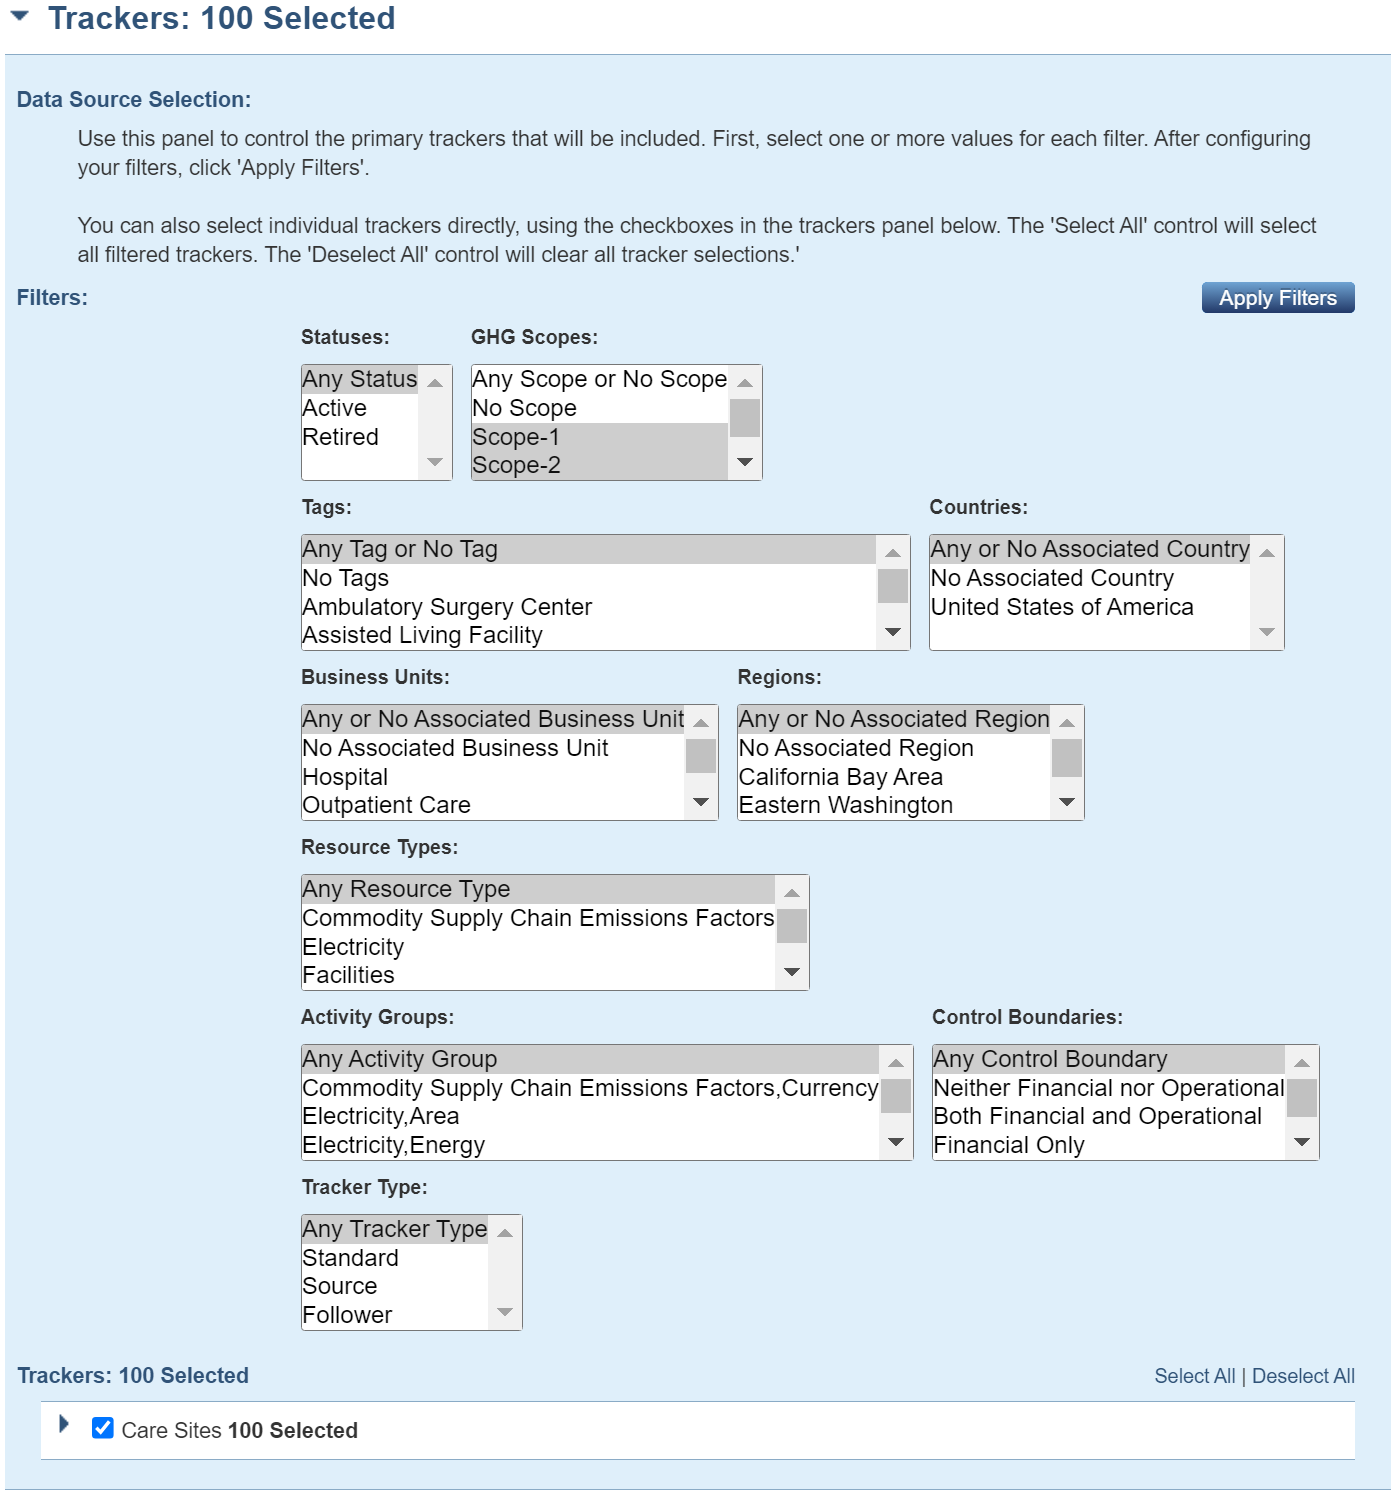
3. Expand the tracker selection pane. Under the GHG Scopes filter, Select Scope 1 and Scope 2. Make sure to click apply filters after selecting the appropriate trackers:
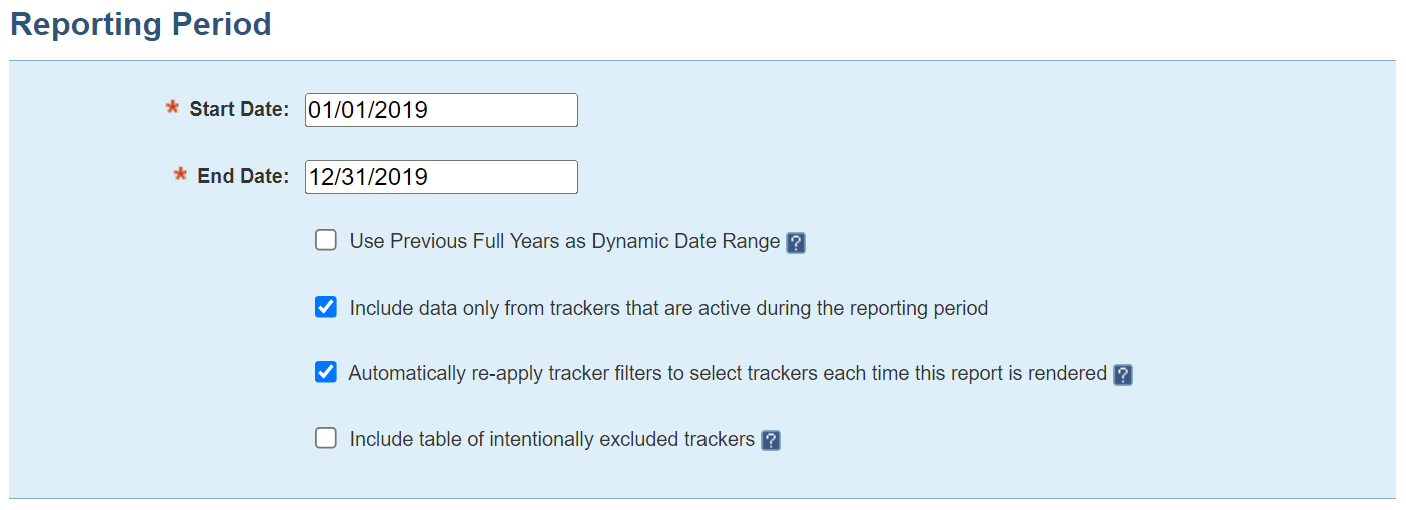
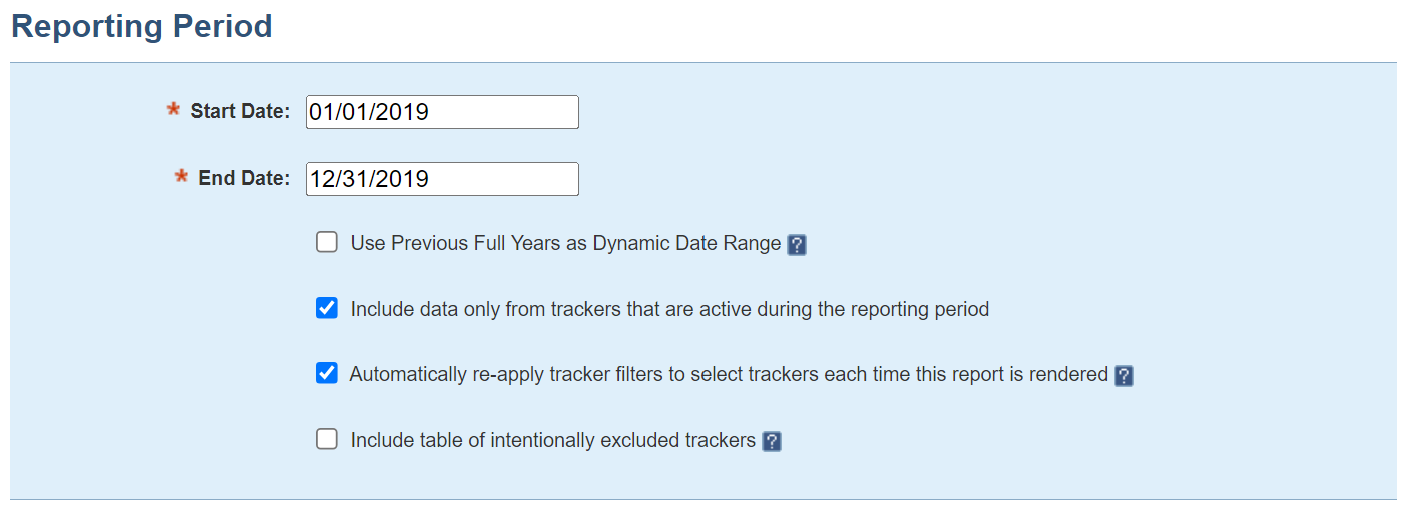
4. Enter the first and last days of your base year in the Start Date and End Date fields, respectively. As a best practice, check the box to include data only from trackers that are active during the reporting period.
5. In Data Columns pane, click the check-box next to Compare Scope 2 Methods:
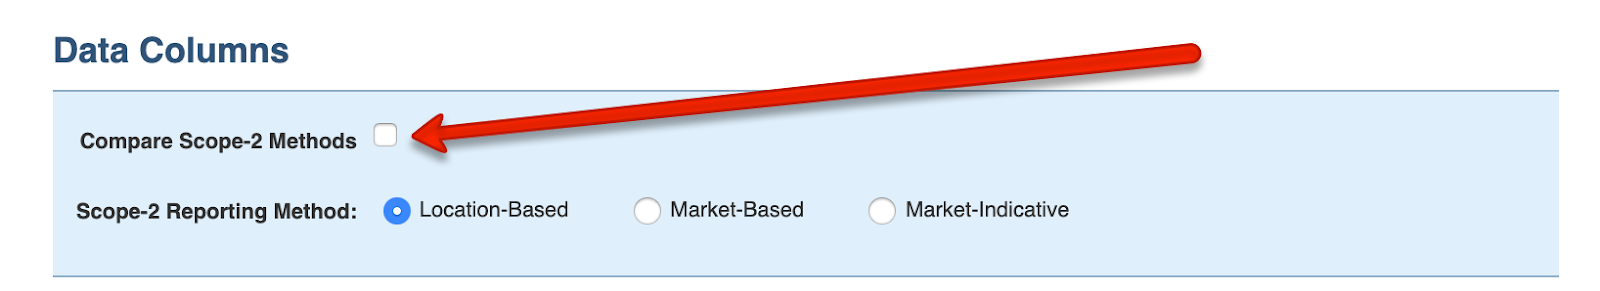
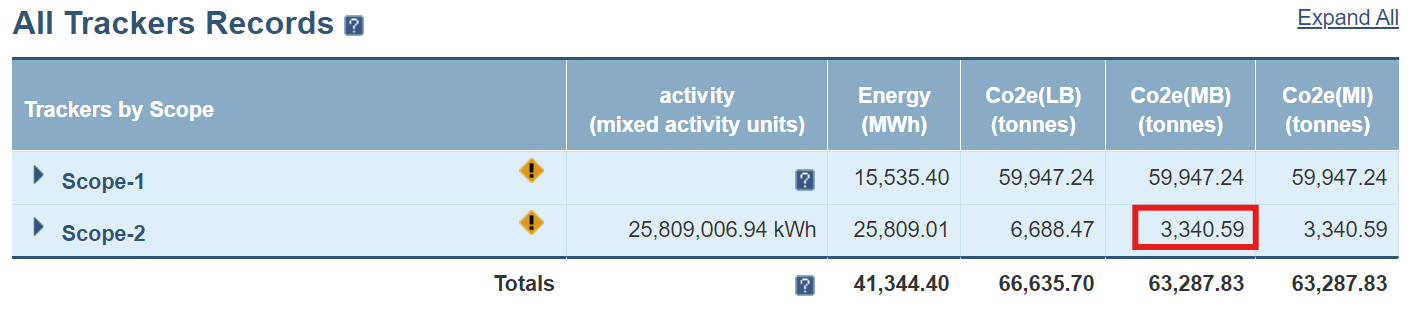
Once the report is generated, there will be an energy, location-based, market-based, and market-indicative total presented for each Scope.
6. In the Display Options section, set Primary Grouping to –All Trackers– and Secondary Grouping to Scope.
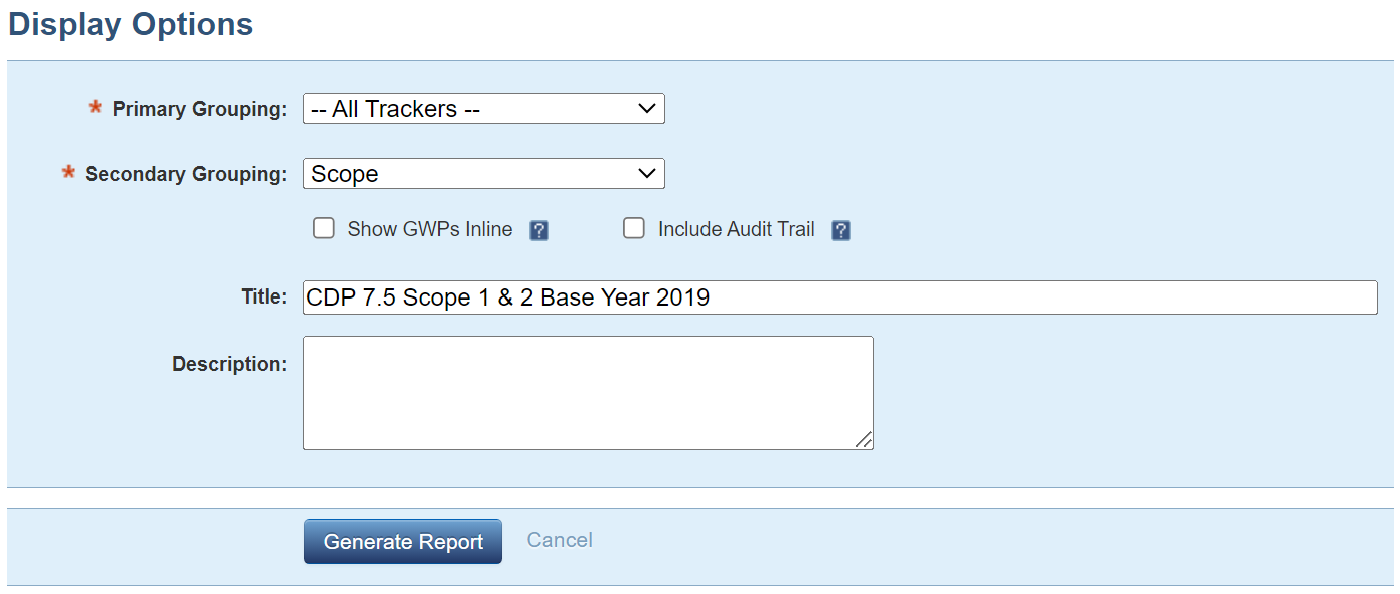
7. Name the report as appropriate (in the Title section), then click the Generate Report.
8. Be sure to verify that there are no unexpected exclusions.
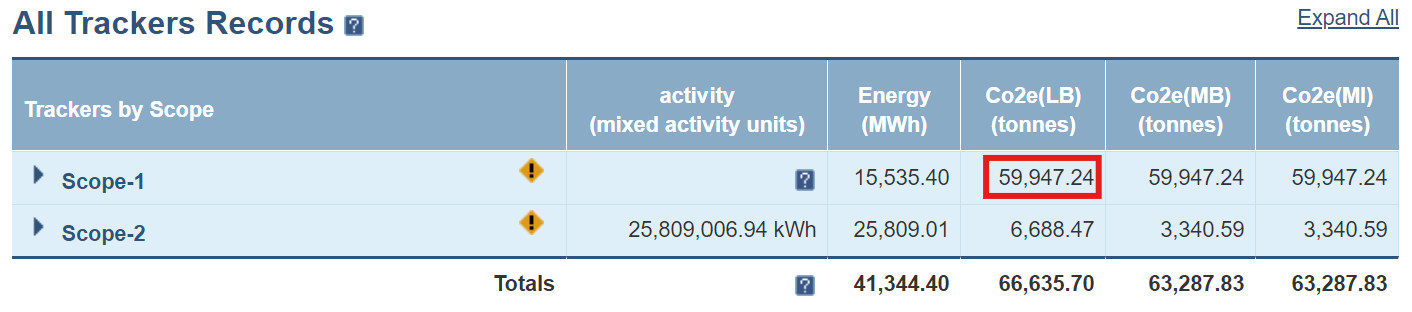
9. Results will be presented by scope.
10. Use the CO2e number from the row labeled Scope 1 and the column titled CO2e(LB) (tonnes) as your response to Scope 1 base year emissions (metric tonnes CO2e).
11. Use the CO2e number from the row labeled Scope 2 and the column titled CO2e(LB) (tonnes) as your response to Scope 2 location-based base year emissions (metric tonnes CO2e).
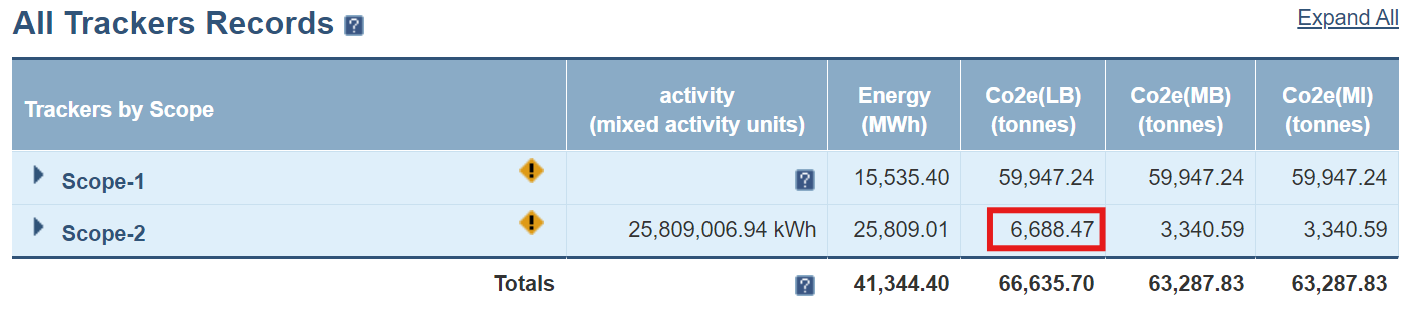
12. Use the CO2e number from the row labeled Scope 2 and the column titled CO2e(MB) (tonnes) as your response to Scope 2 market-based base year emissions (metric tonnes CO2e).
Base year emissions - Scope 3 & Scope 3 Categories
Note: The categories listed under Scope 3 Category (the first column of the table of this question) serve as a good starting point for categorizing Scope 3 emissions in Scope 5. You may find it convenient to organize your custom resources according to these groups or to use a group of tags to categorize trackers accordingly. Please contact us if you would like help adding a group of tags or organizing resources in a way that will make it easy to generate the report to answer this question.
1. From the top level of the Node Navigator, select Distribution Reports.
2. Click Add a New Report.
3. Expand the tracker selection pane. Under the GHG Scopes filter, Select Scope 3.
4. Enter the base year reporting dates into the Start Date and End Date fields.
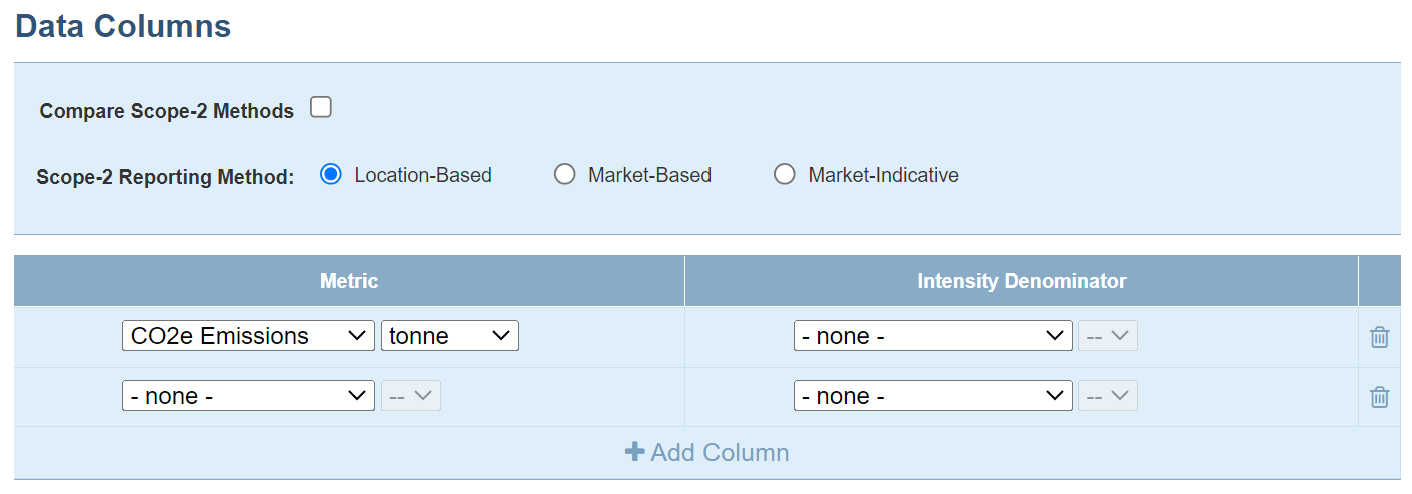
5. Under Data Columns select CO2e Emissions as the metric in the first select box. For the units, select tonne in the select box immediately to the right.
6. Other select boxes in the Data Columns section should be set to - none -.
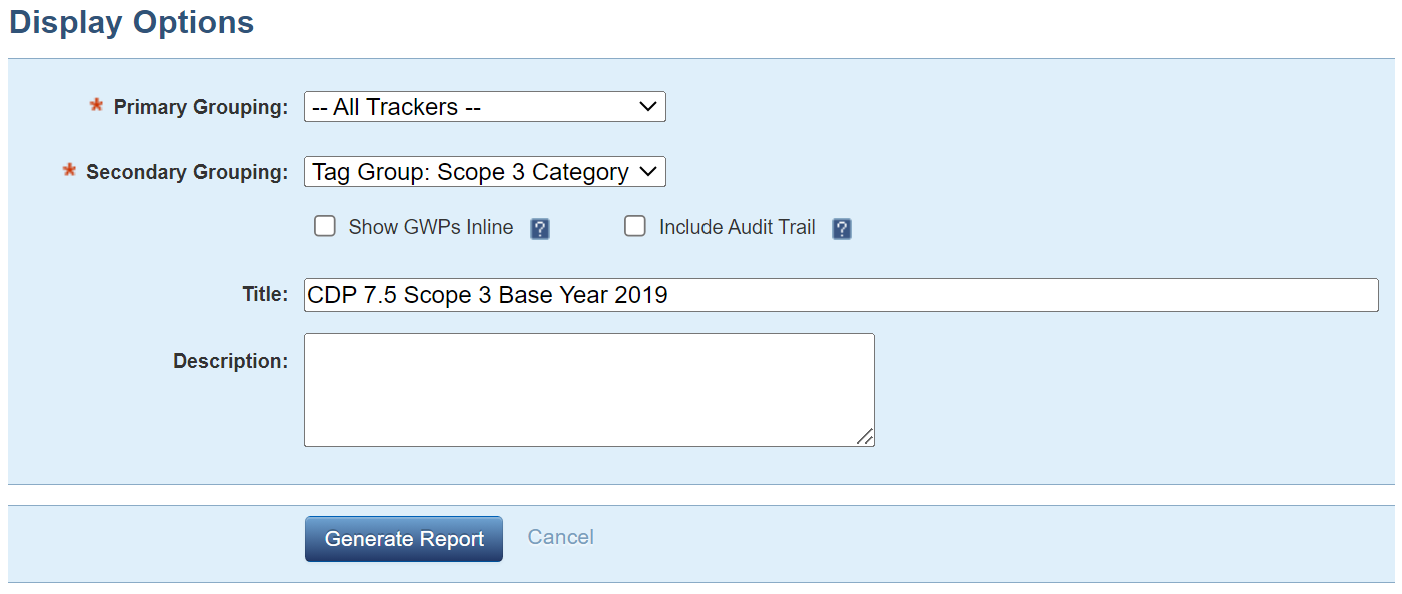
7. In the Display Options section, set Primary Grouping to – All Trackers – and Secondary Grouping to Resource Type or Tag Group (see note above).
8. Name the report as appropriate (in the Title section), then click the Generate Report.
9. Be sure to verify that there are no unexpected exclusions.
10. Results will be presented by Scope and organized by either Resource Type or Tag Group.
11. Use the CO2e number from each row in the report for each of the Sources of Scope 3 emissions (metric tons CO2e).
7.6 What were your organization's gross global Scope 1 emissions in metric tons CO2e?
7.7 What were your organization's gross global Scope 2 emissions in metric tons CO2e?
Follow the directions for 7.5, adjusting the report dates to reflect those of the reporting year and past years if applicable.
7.8 Account for your organization's gross global Scope 3 emissions, disclosing and explaining any exclusions.
7.8.1 Disclose or restate your Scope 3 emissions data for previous years.
Follow the directions for 7.5, adjusting the report dates to reflect those of the reporting year and past years if applicable.
7.10 How do your gross global emissions (Scope 1 and 2 combined) for the reporting year compare to those of the previous reporting year?
1. From the top level of the Node Navigator, select Periodic Reports.
2. Click Add a New Report.
3. Expand the tracker selection pane. Under the GHG Scopes filter, select Scope 1 and Scope 2.
4. Select Annually for Periodicity then select both the current reporting year and the year prior to the current reporting year.
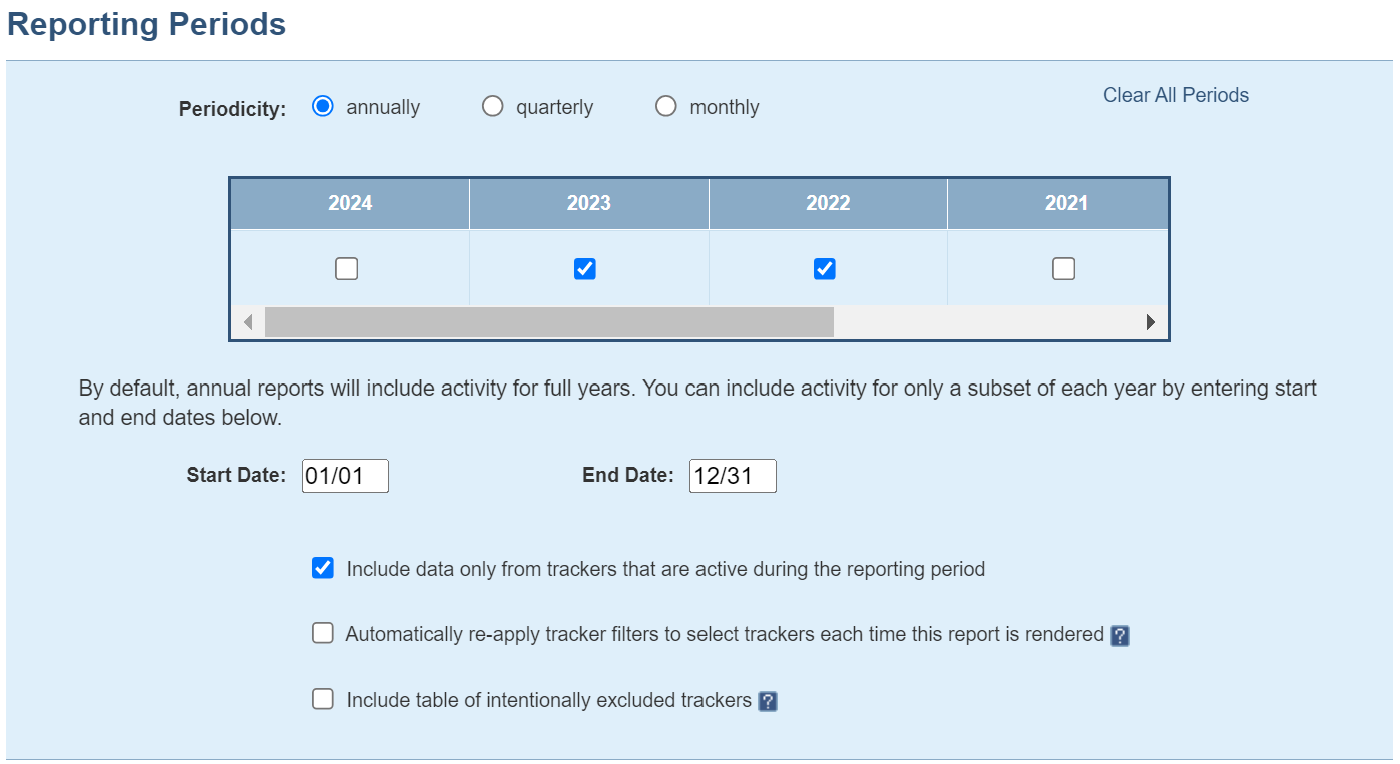
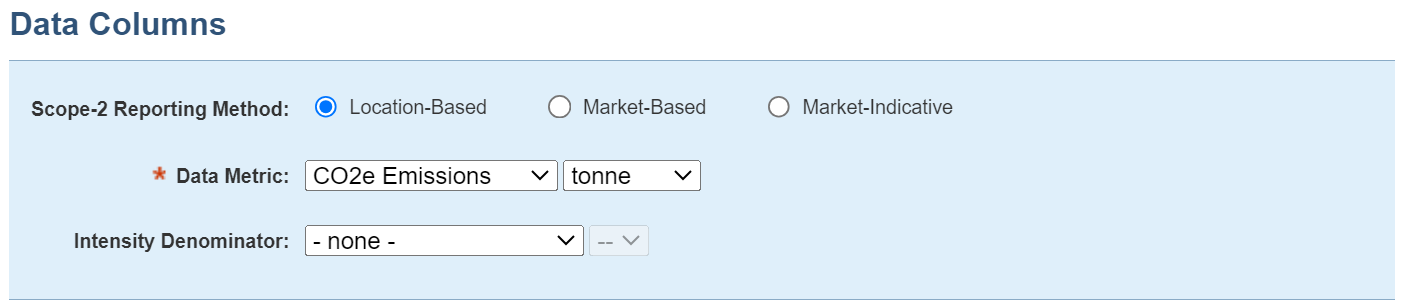
5. Under Data Columns select CO2e Emissions as the metric in the first select box. For the units, select tonne. Leave the intensity denominator set to none.
6. In the Display Options section, set Primary Grouping to -- All Trackers -- and Secondary Grouping to Scope.
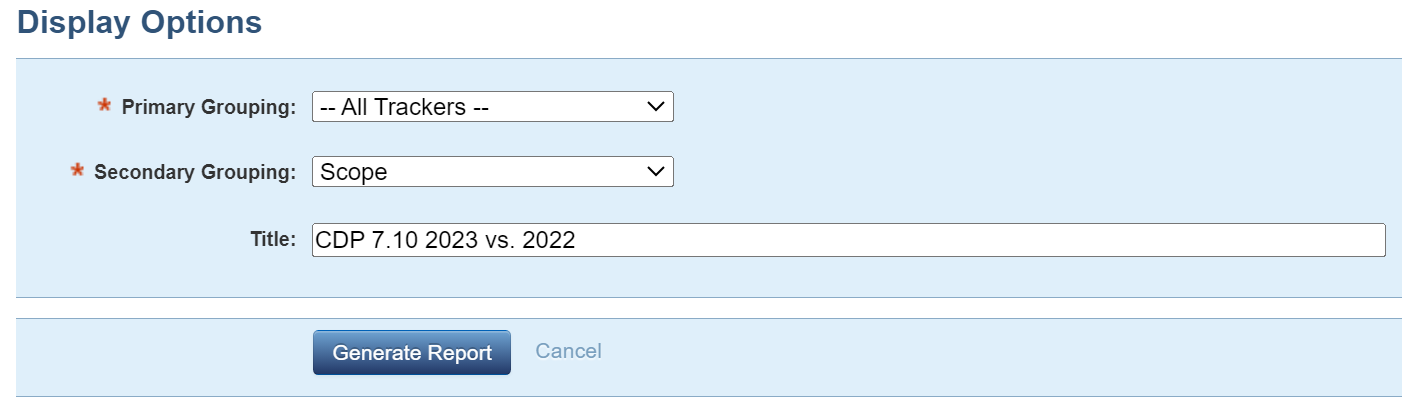
7. Name the report as appropriate (in the Title section), then click Generate Report.
8. Be sure to verify that there are no unexpected exclusions.
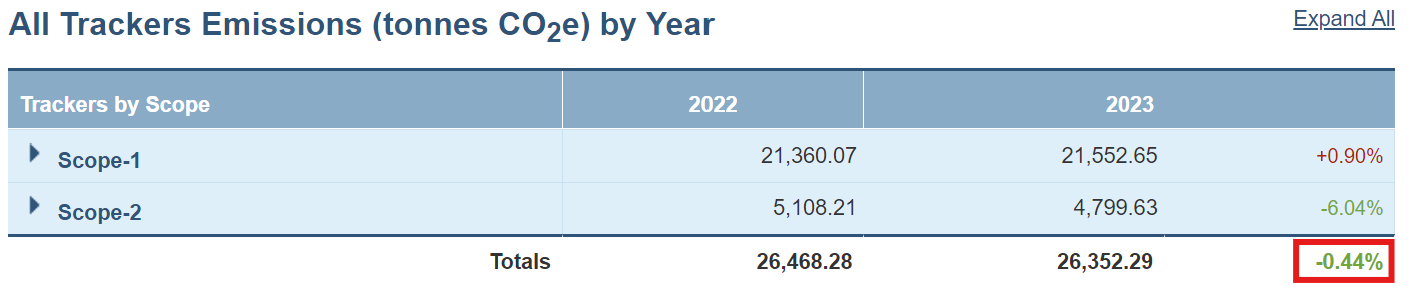
9. The report will show one column per calendar or fiscal year (depending on the configuration of your account).
10. Use the percent change listed in the Totals row under the column for the current reporting year to determine how your gross global emissions (Scope 1 and Scope 2 combined) for the reporting year compare to those of the previous year. Note that red numbers preceded by a plus sign indicate an increase from the previous year and green numbers preceded by a minus sign indicate a decrease from the previous year. Use this to answer 7.10:
7.10.1 Identify the reasons for any change in your gross global emissions (Scope 1 and 2 combined), and for each of them specify how your emissions compare to the previous year.
To use Scope 5 reports to answer 7.10, we recommend an iterative process of re-running the report and changing the Secondary Grouping (step 6) several times to understand where emissions changed. First click Expand All in the top right corner to inspect each row and evaluate if emissions increased or decreased on that row. Then, consider comparing the data by Resource Type or Country. Categorizing the report however best helps you analyze the reasons for the change. Each time the report is regenerated, the percent change column will update based on your grouping, which can inform how you fill in the CDP table.
7.12.1 Provide the emissions from biologically sequestered carbon relevant to your organization in metric tons CO2.
Follow the directions for 7.5, except:
1. In step 5, adjust the Start Date and End Date to reflect the current reporting year.
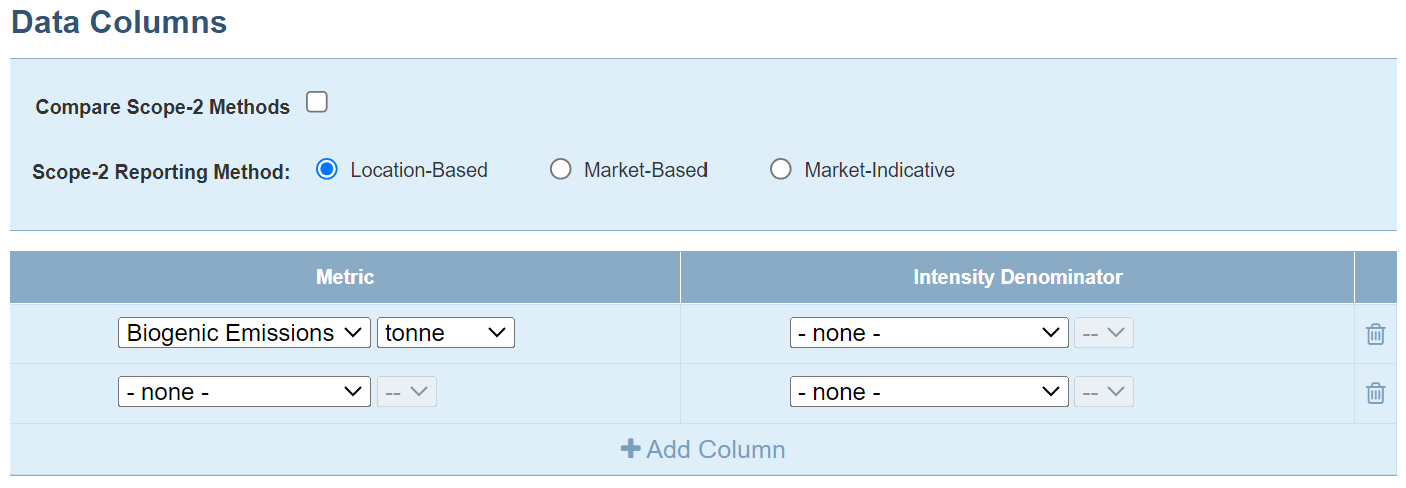
2. In step 6, replace the metric with Biogenic Emissions. In the dropdown select immediately to the right, select tonne:
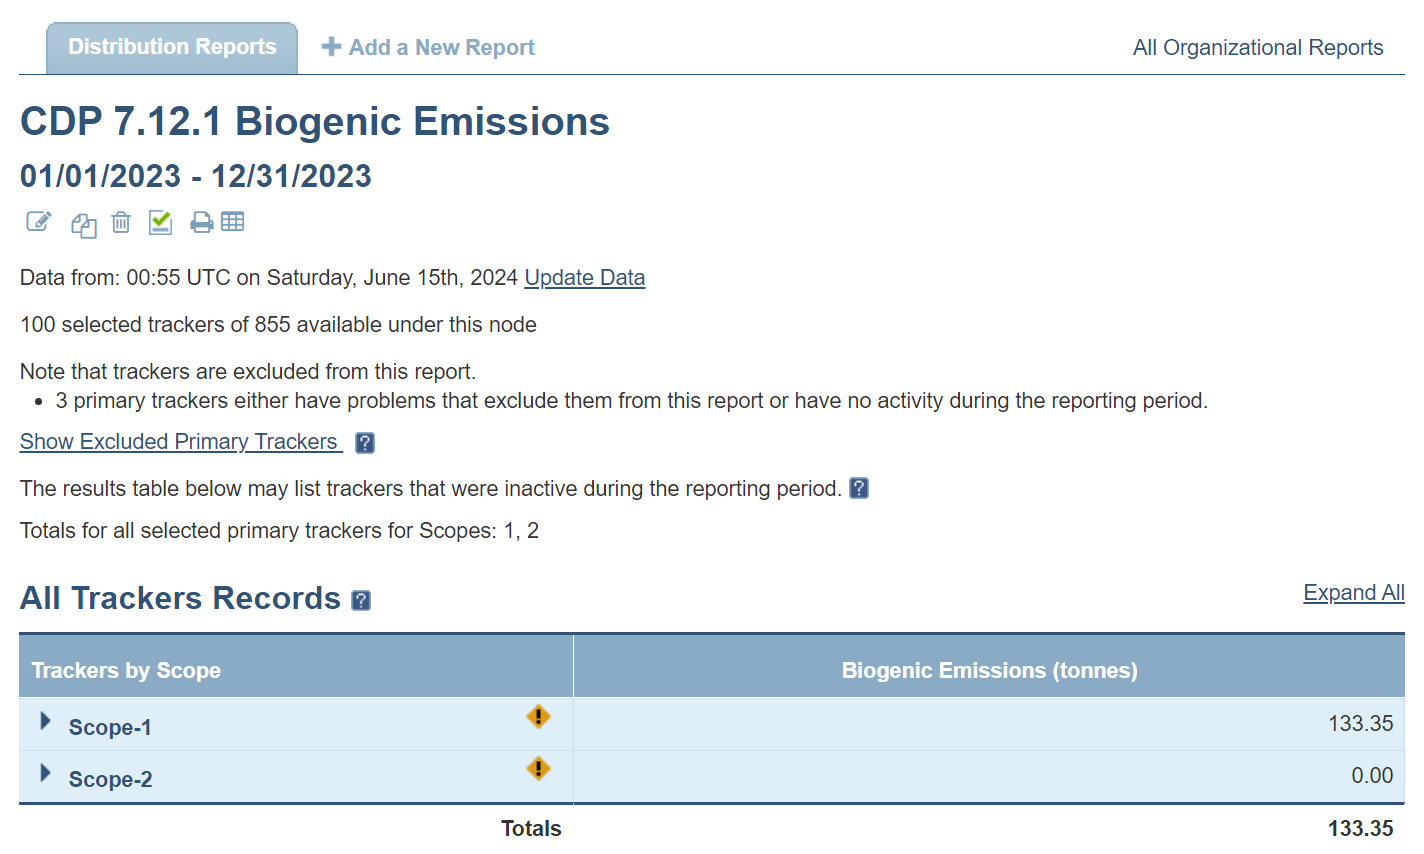
3. Use the Biogenic Emissions (tonnes) number at the bottom of the table in the Totals row as your response to 'emissions from biogenic carbon'.
Comments