
7.15.1 Break down your total gross global Scope 1 emissions by greenhouse gas type and provide the source of each used global warming potential (GWP).
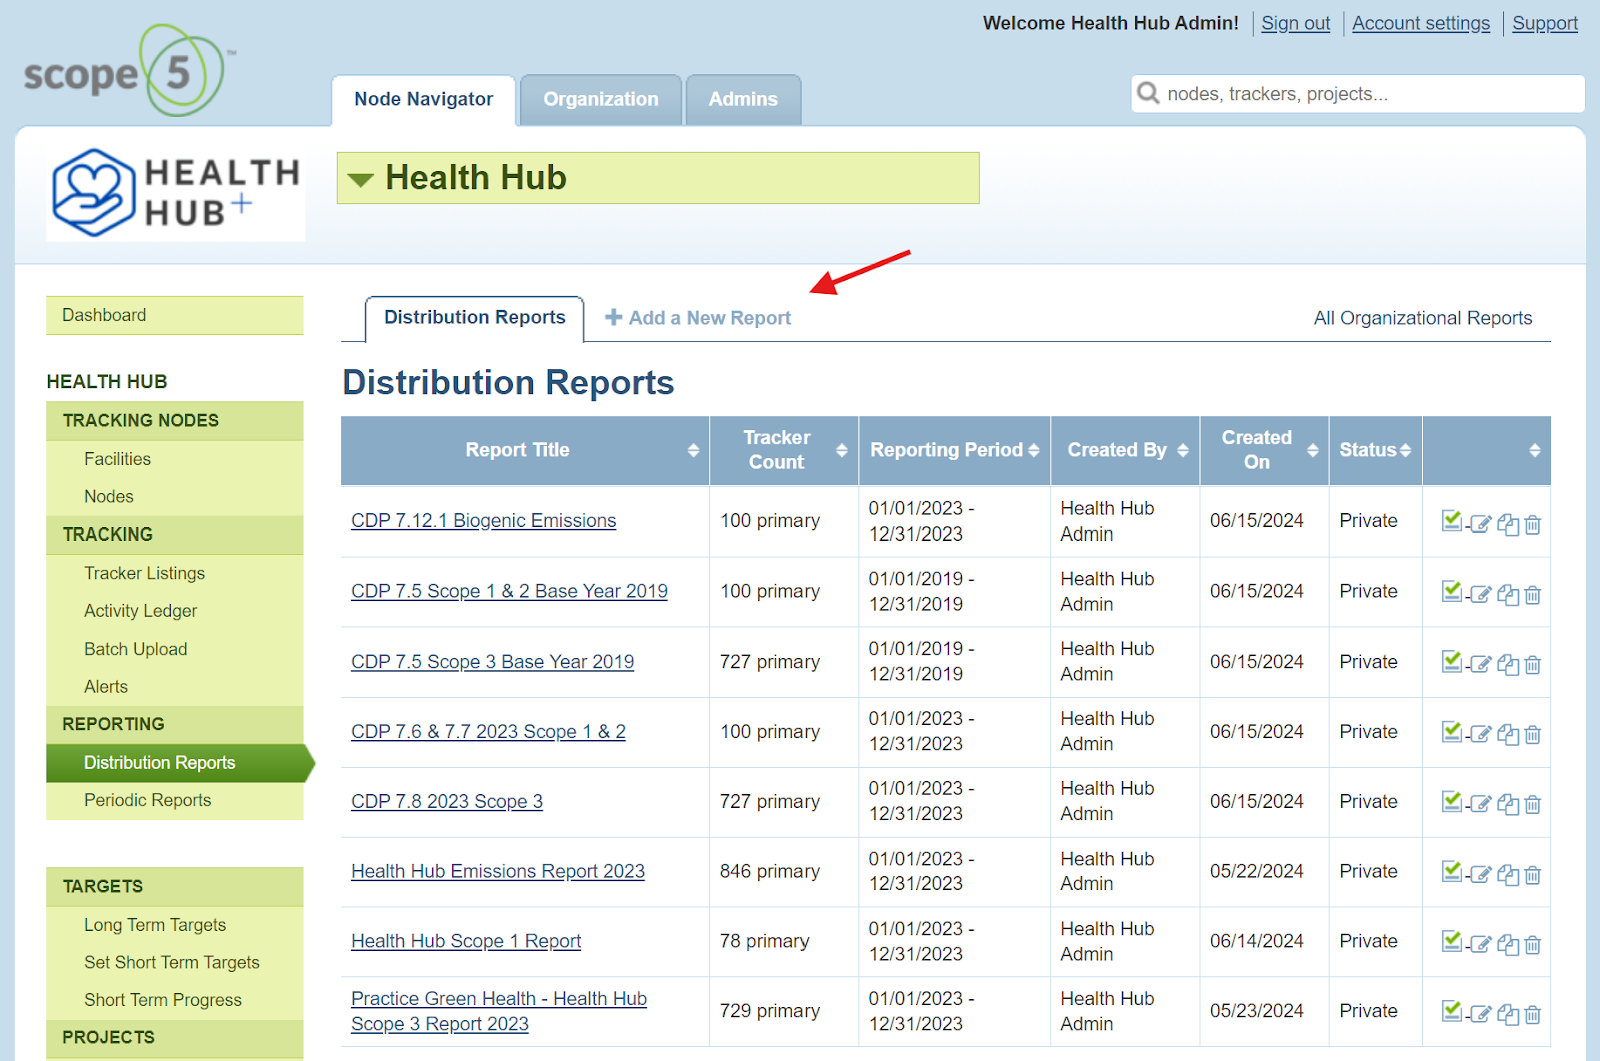
1. From the top level of the Node Navigator, select Distribution Reports.
2. Click Add a New Report.
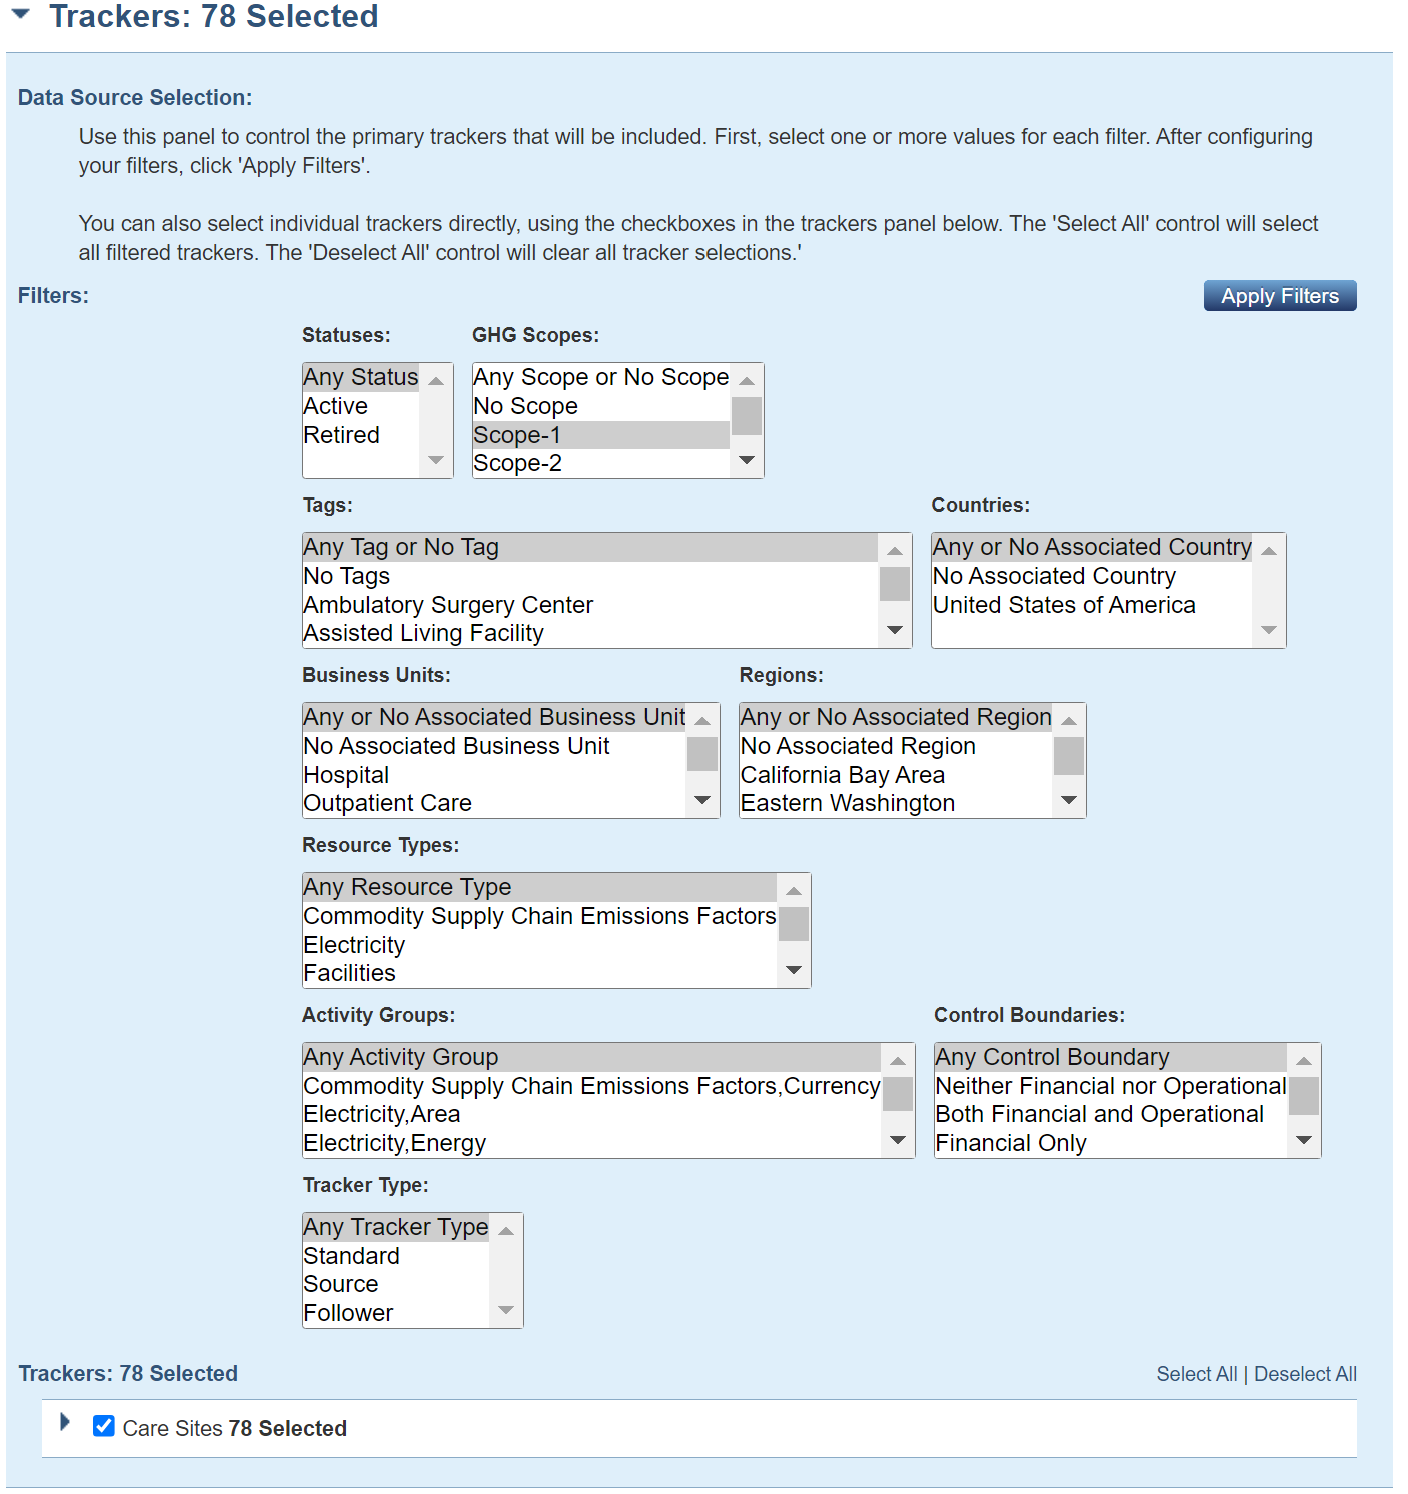
3. Expand the tracker selection pane. Under the GHG Scopes filter, select Scope 1.
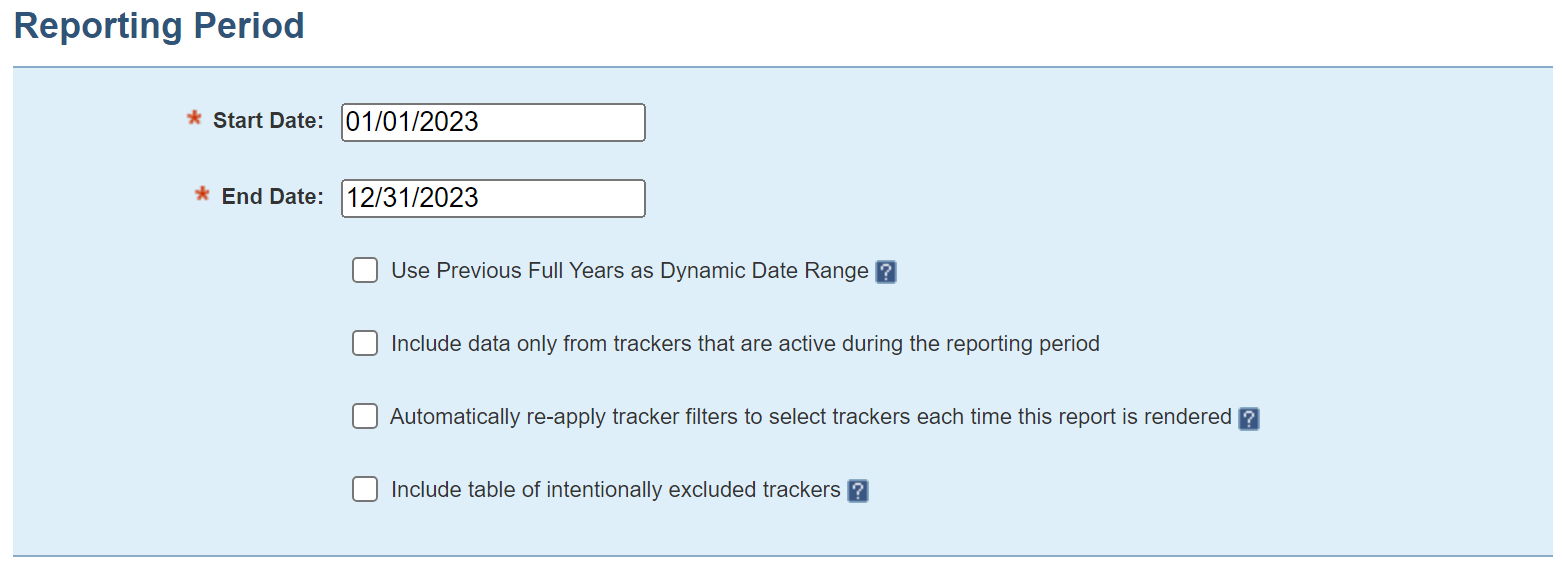
4. Enter the first and last days of your reporting year in the Start Date and End Date fields, respectively.
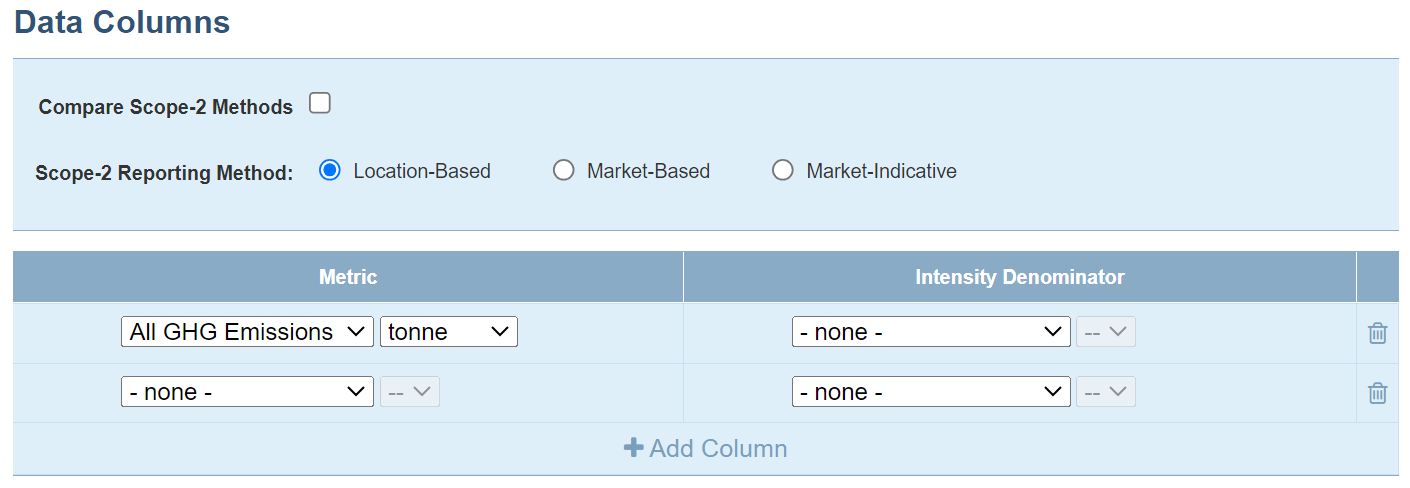
5. Under Data Columns select All GHG Emissions as the metric in the first select box. For the units, select tonne.
6. Other select boxes in the Data Columns section should be set to - none -.
7. In the Display Options section, set Primary Grouping to –All Trackers – and Secondary Grouping to Scope.
8. Click the check box titled Show GWPs Inline (for more details, refer to this article on adding GWP sources to distribution reports):
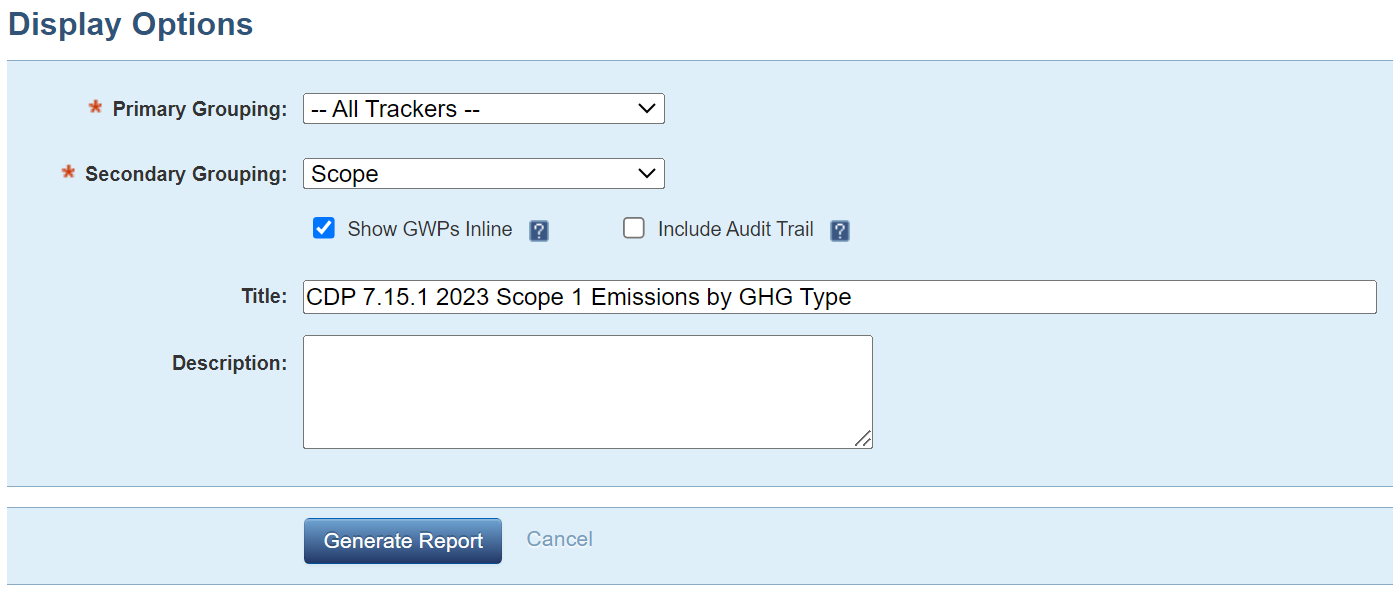
9. Name the report as appropriate (in the Title section), then click Generate Report.
10. Be sure to verify that there are no unexpected exclusions.
11. Under the heading All GHG Emissions , there will be a separate column for each of the greenhouse gas (GHG) types.
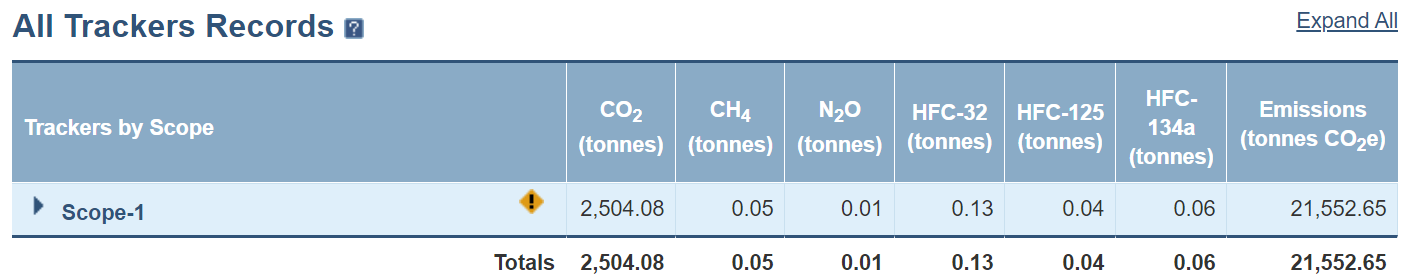
12. The GWP source used to calculate each tracker's CO2e will be listed in parentheses next to the tracker name on each row of the report.
13. The GWP source used to calculate each tracker's CO2e will be listed in parentheses next to the tracker name on each row of the report.
14. Numbers for less common GHGs may have to be summed to provide the responses strictly in the categories specified by the CDP. For example, in the Scope 5 report, there may be multiple HFCs, each listed under a different column. The CDP report calls for these to be summed into a single response.
15. Note that the numbers in the component gas columns (all but the last column, titled CO2e) represent the actual weight of each GHG emitted, which does not consider the gas's global warming potential (GWP) and therefore is not the same as the CO2e of the gas. The number in the last column (titled CO2e) does represent the total GWP of all the component GHGs for that particular row.
16. In order to report the emissions for each greenhouse gas type separately, multiply the weight of the gas emitted by its GWP. The GWP value will be listed next to the tracker name. Specific GWP values per GWP reference can be found by inspecting individual resources in Scope 5 or the links in this article. Enter the result of this calculation into Scope 1 emissions (metric tons in CO2e) and the GWP used into GWP Reference.
17. When looking at component gas numbers, which tend to be small, it may be helpful to increase the number of significant digits after the decimal point. To do this, go to Organization → Preferences and Settings → Display Formatting → Numeric Precision.
7.16 Break down your total gross global Scope 1 and 2 emissions by country/area.
Follow steps 1-8 described above in 7.15.1, except:
- In step 3, Under the GHG Scopes filter, select Scope 1 and Scope 2
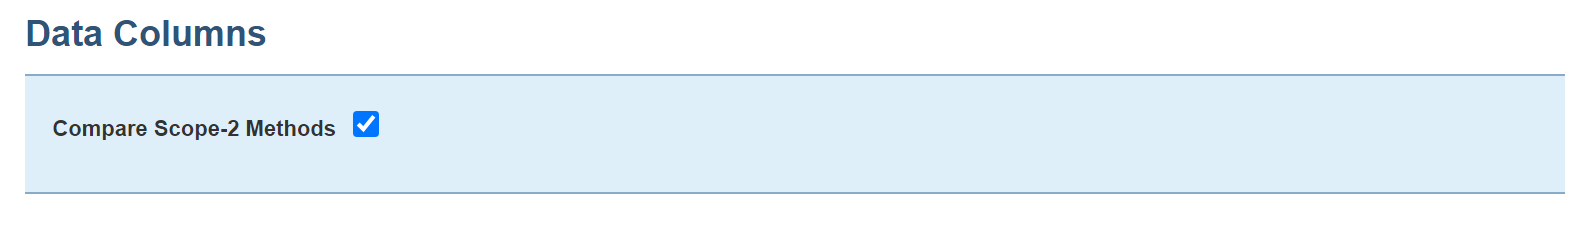
- Before step 5, select Compare Scope-2 Methods
2. In step 7, set Primary Grouping to Scope and Secondary Grouping to Country or Region. Then click Generate Report.
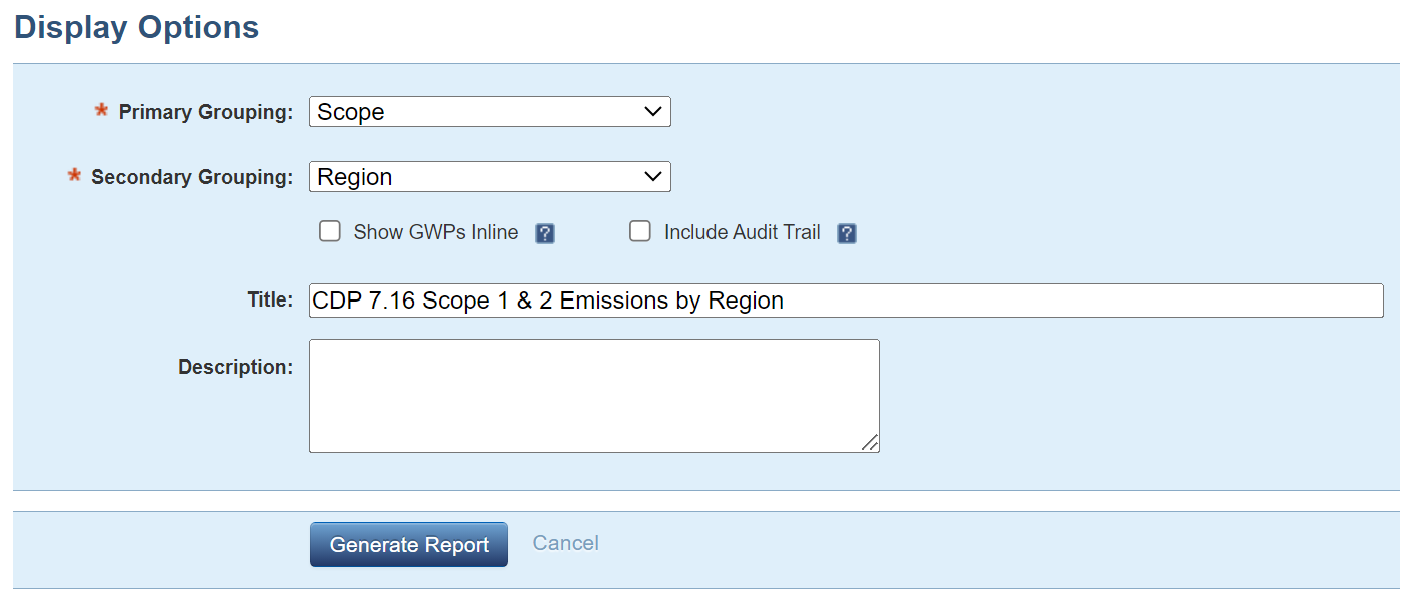
3. Results will show Scope 1 and 2 emissions for each country or region. Under each table, results will show Energy (MWh), location-based emissions (tonnes), market-based emissions (tonnes) and market-indicative emissions (tonnes), for each country/region.
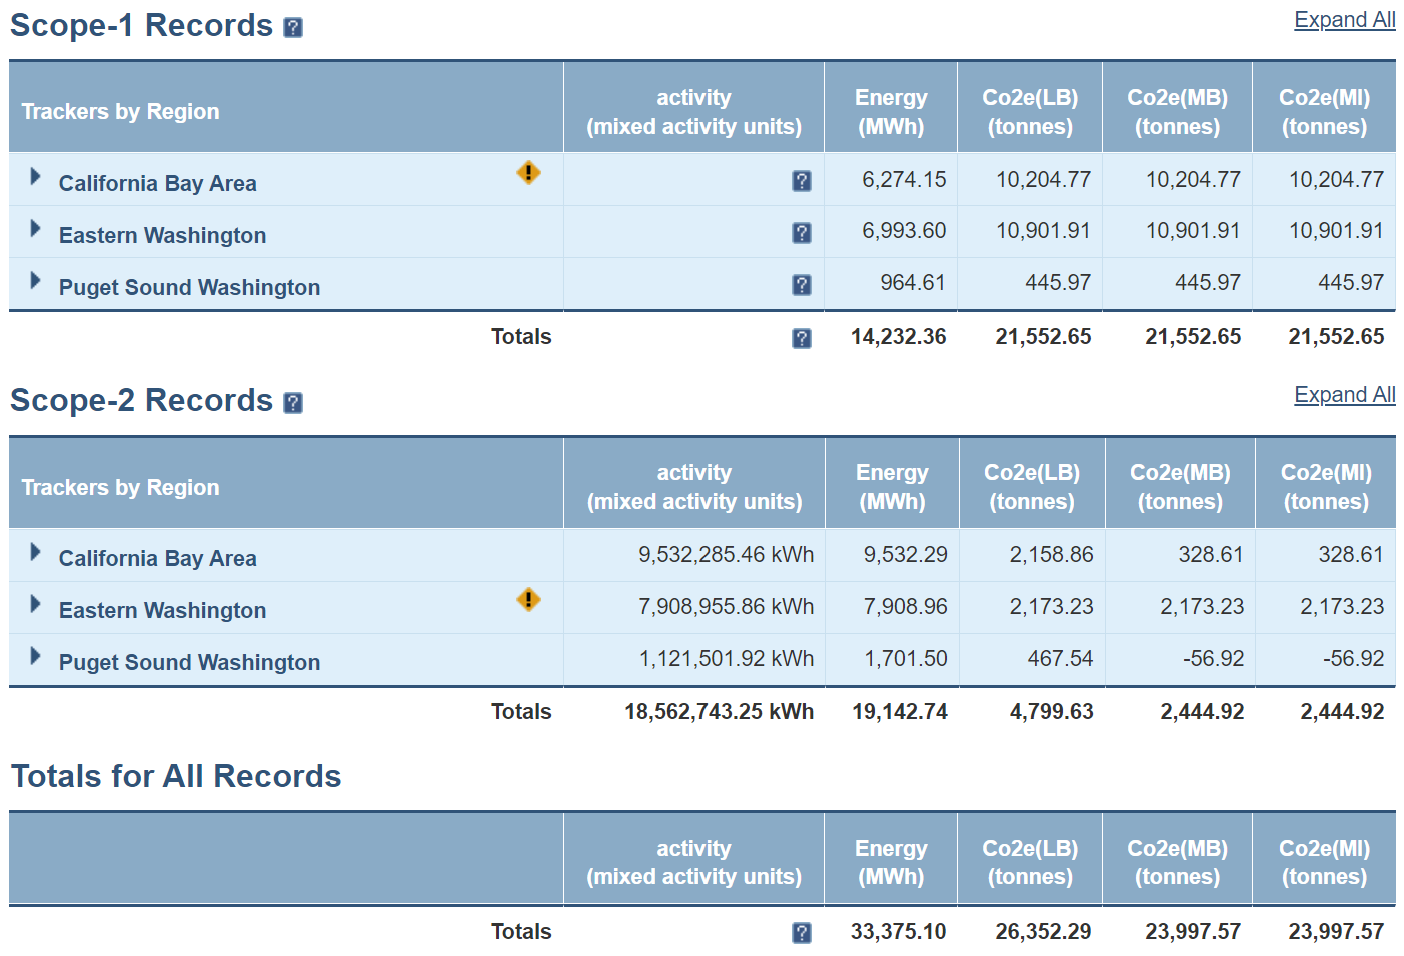
4. Be sure to verify that there are no unexpected exclusions or emissions categorized as No Country Assigned. If emissions are categorized as No Country Assigned, this information can be added in the Details pane on each Facility Settings page.
5. Use the totals in the CO2e (LB) (tonnes) column in each country or region's row under Scope-1 Records as your answer to Scope 1 emissions (metric tons CO2e).
6. Use the totals in the CO2e (LB) (tonnes) column in each country or region’s row under Scope-2 Records as your answer to Scope 2, location-based (metric tons CO2e).
7. Use the totals in the CO2e (MB) (tonnes) column in each country or region’s row under Scope-2 Records as your answer to Scope 2, marked-based (metric tons CO2e).
7.17 Indicate which gross global Scope 1 emissions breakdowns you are able to provide. (Choose from By business division, By facility and/or By activity.)
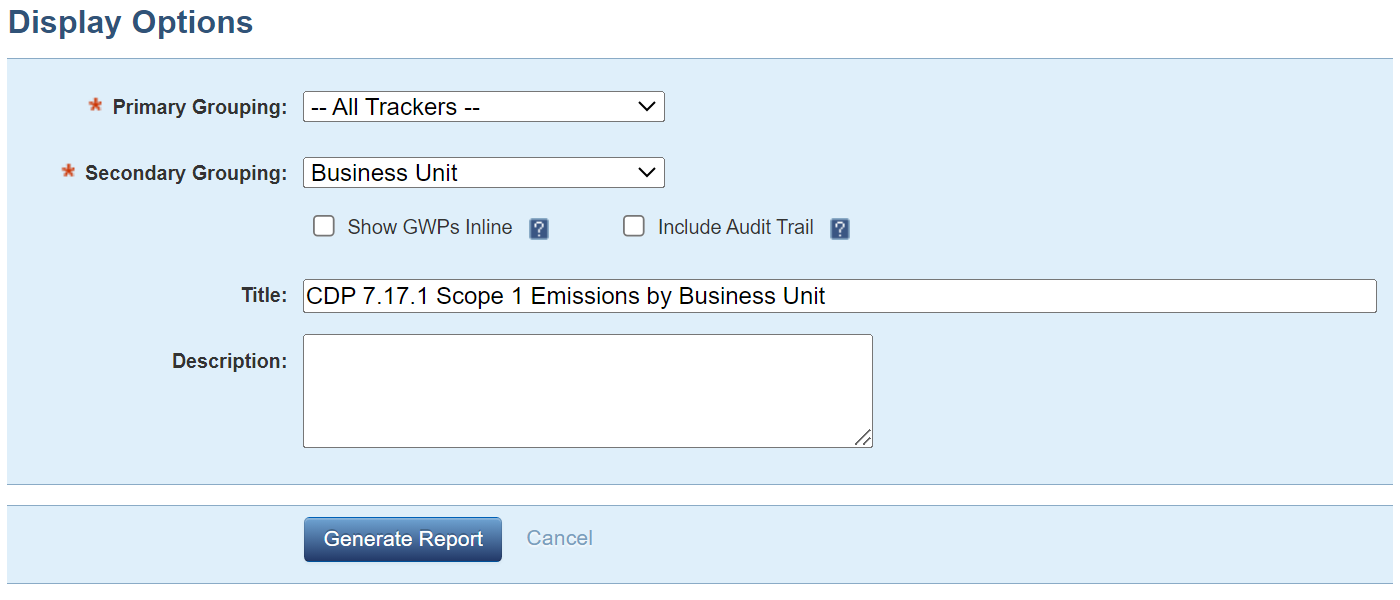
7.17.1 Break down your total gross global Scope 1 emissions by business division.
Follow the steps under 7.16, but instead select only Scope 1 trackers in the selection pane and under Data Columns select CO2e Emissions as the metric in the first select box and for units select tonne. In the Display Options section, set Secondary Grouping to Business Unit. (This assumes that the Business Unit field has been set correctly for all relevant facility or tracking nodes. Please contact us for help.)
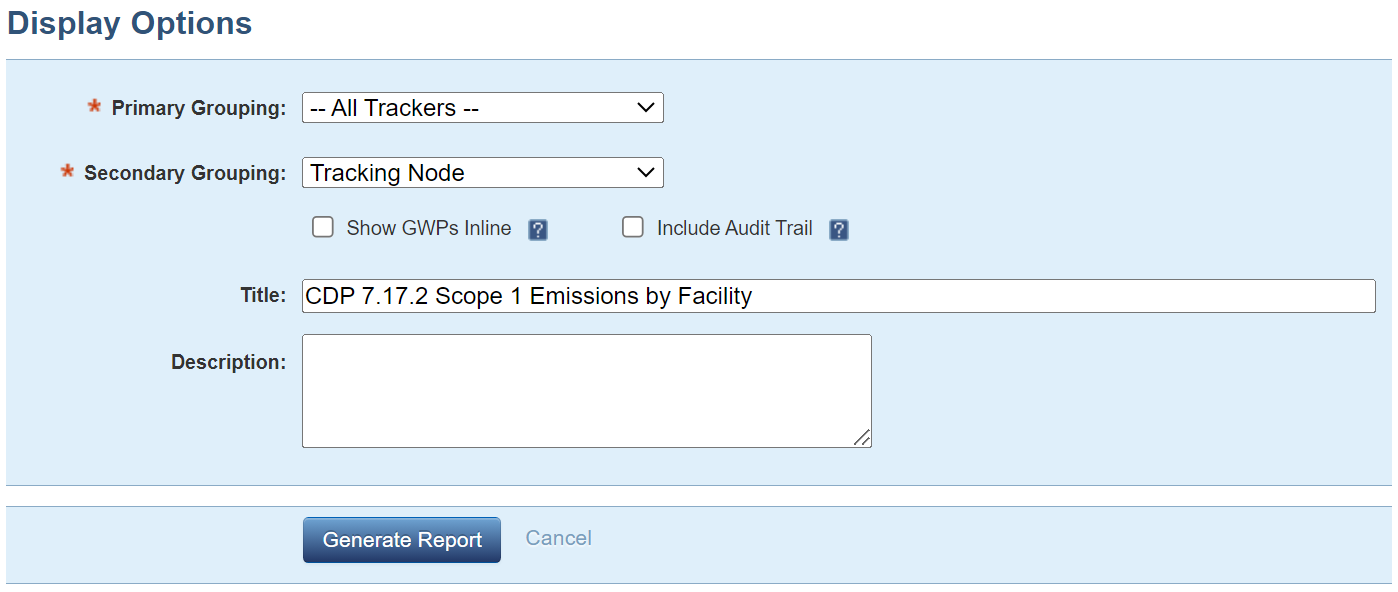
7.17.2 Break down your total gross global Scope 1 emissions by business facility.
Follow the steps under 7.17.1 but in the Display Options section, set Secondary Grouping to Tracking Node.
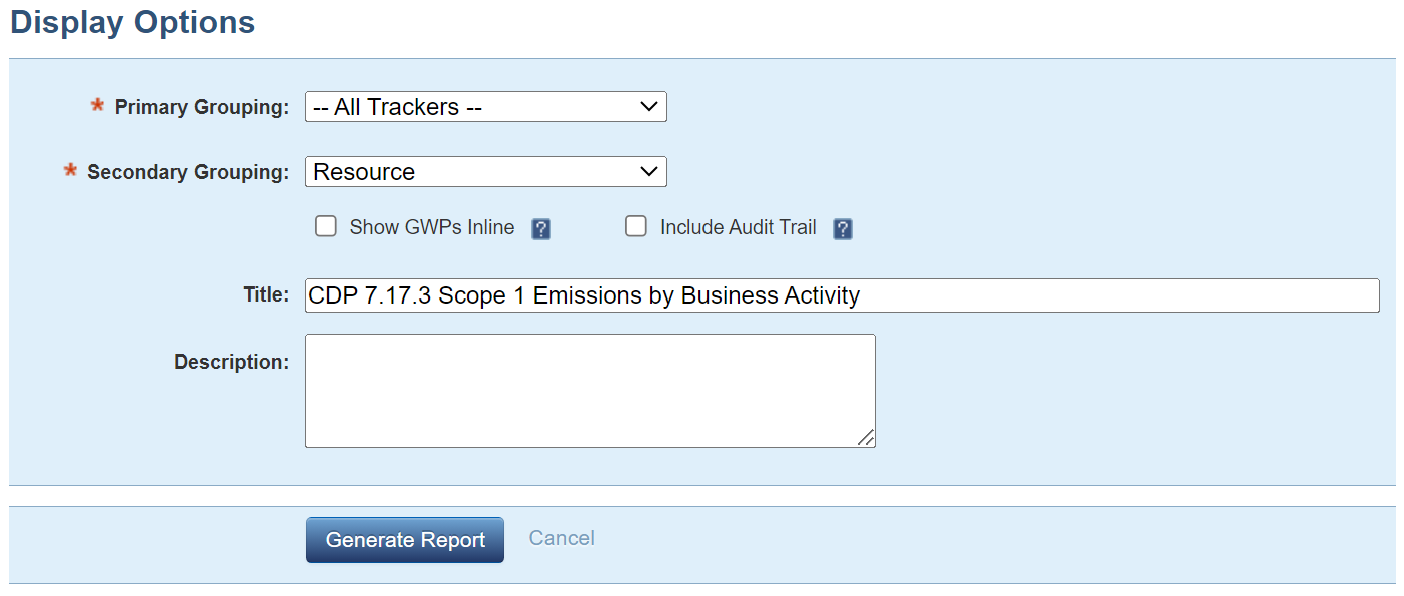
7.17.3 Break down your total gross global Scope 1 emissions by business activity.
Follow the steps under 7.17.1 but in the Display Options section, set Secondary Grouping to Resource.
7.20 Indicate which gross global Scope 2 emissions breakdowns you are able to provide.
(Choose from By business division, By facility and/or By activity.)
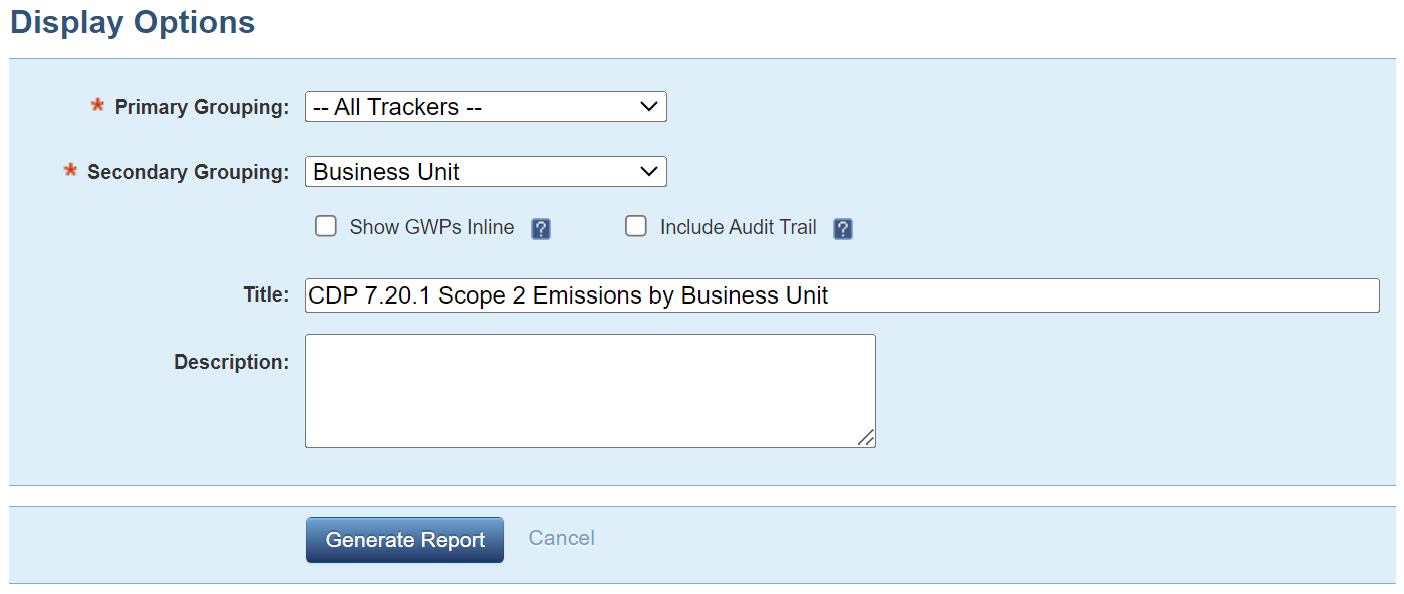
7.20.1 Break down your total gross global Scope 2 emissions by business division.
Follow the steps under 7.17.1 but in the Tracker Selection pane, select all Scope 2 trackers. Under Data Columns select Compare Scope-2 Methods. Make sure in the Display options section the Secondary Grouping is set to Business Unit. (This assumes that the Business Unit field has been set correctly for all relevant facility or tracking nodes. Please contact us for help.)
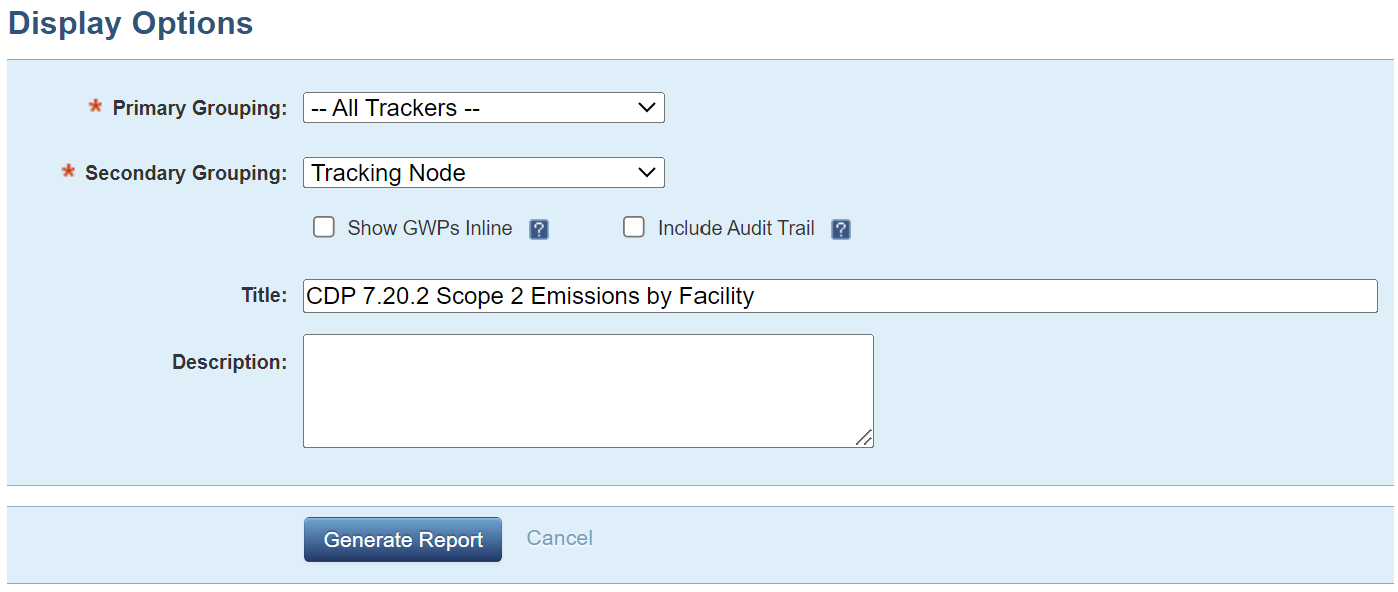
7.20.2 Break down your total gross global Scope 2 emissions by business facility.
Follow the steps under 7.20.1 but in the Display Options section, set Secondary Grouping to Tracking Node.
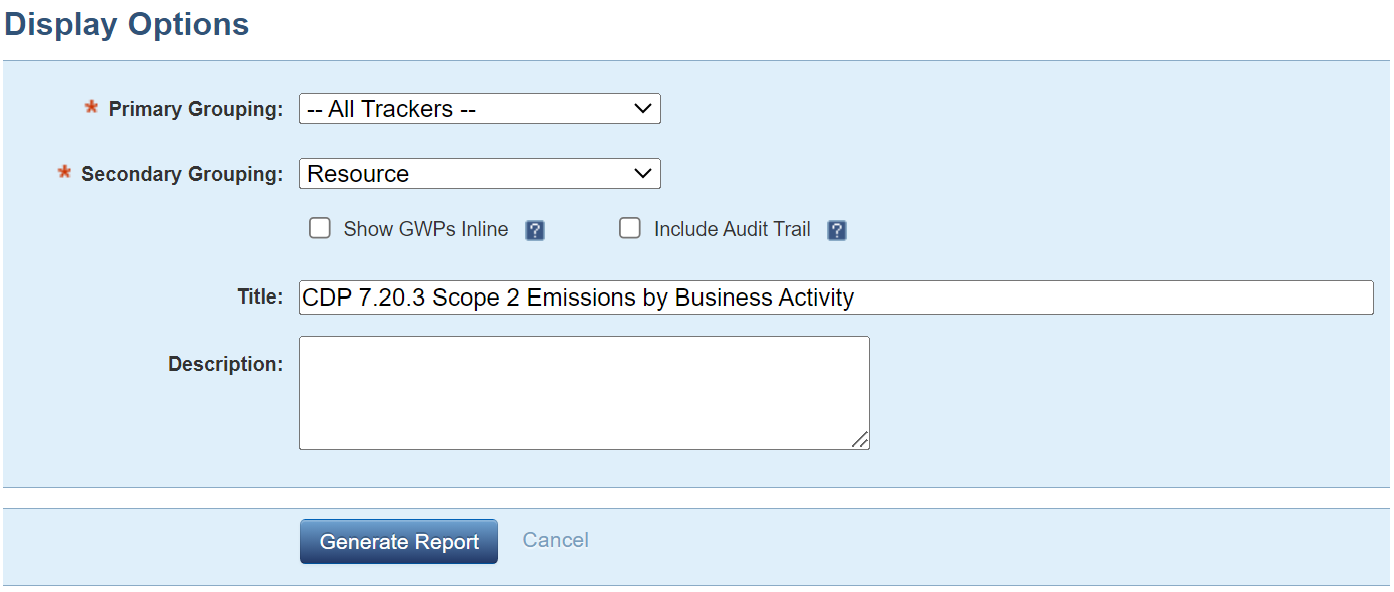
7.20.3 Break down your total gross global Scope 2 emissions by business activity.
Follow the steps under 7.20.1 but in the Display Options section, set Secondary Grouping to Resource.
7.23 Is your organization able to break down your emissions data for any of the subsidiaries included in your CDP response?
7.23.1 Break down your gross Scope 1 and Scope 2 emissions by subsidiary.
- Follow the steps in 7.15.1 1-7 except:
- In step 3, navigate to the branch where subsidiaries are tracked to create the report. Select Scope 1 and 2 tracker filters. Depending on your account structure, subsidiaries may also be created throughout the branch structure, in which case a tag group will be used. In this scenario, also select the Subsidiaries tag as an additional filter.
- In step 5, select CO2e Emissions as the data metric.
- In step 7, set Primary Grouping to -- Branch Node -- and Secondary Grouping to Scope. Results will show Scope 1 and 2 emissions for each subsidiary.
Note - there are many ways to organize your Scope 5 account to accommodate tracking data for subsidiaries. Typically this is done through the branch structure or tag groups. Please reach out to your Scope 5 account manager for assistance if needed.
Comments